In the image you see below, we are not analyzing just any asset… we are observing the BTC DOM Index (BTCDOMUSDT), the indicator that measures Bitcoin's dominance against the rest of the market. This index not only reflects how much capital is flowing into BTC but also reveals the collective intentions of investors and traders globally.
🔍 Current technical analysis
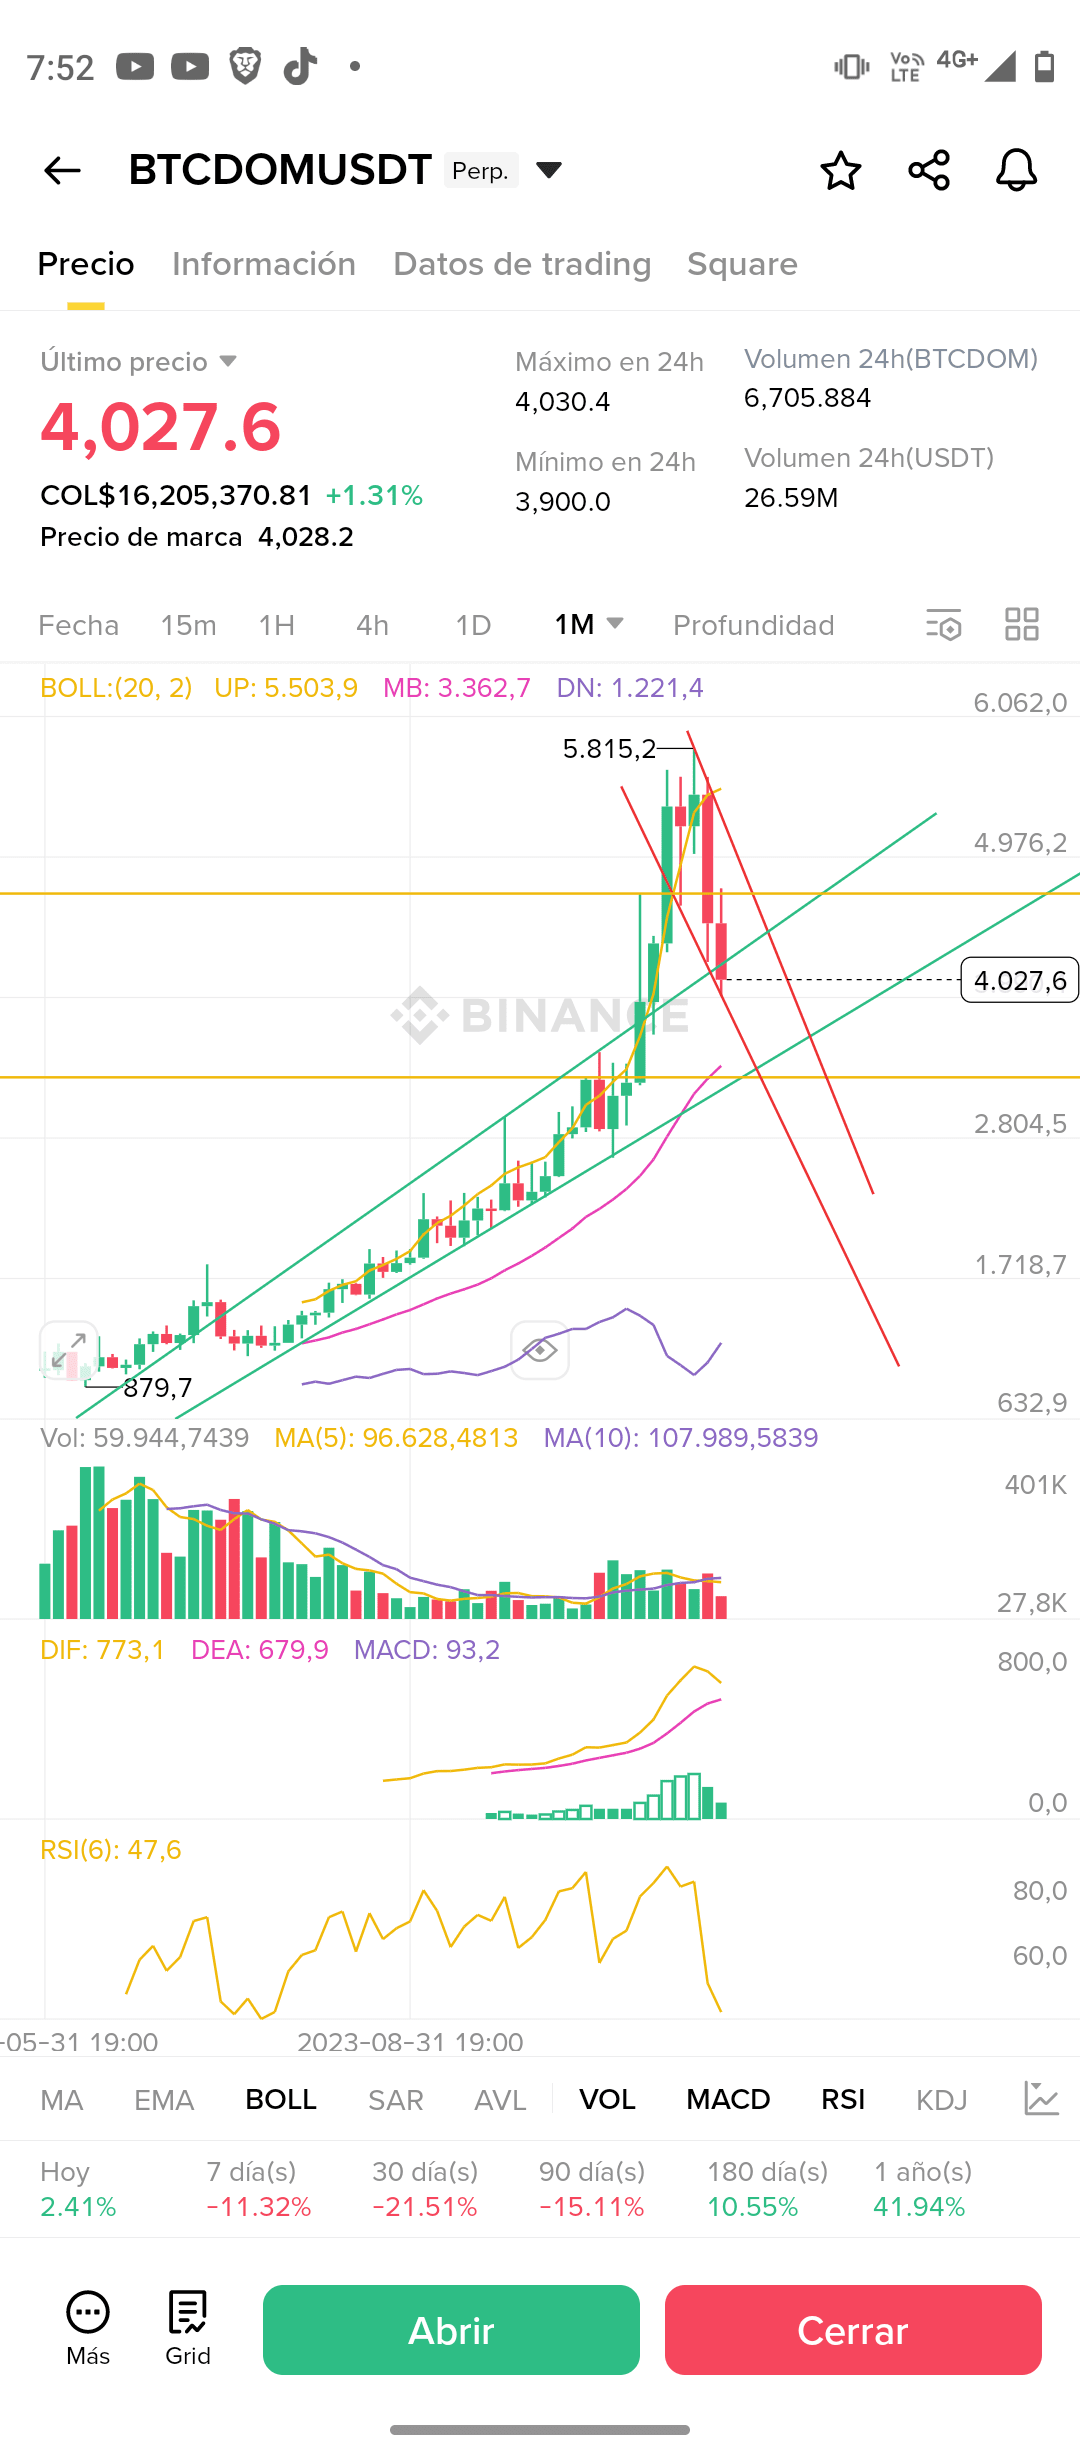
In the monthly chart, dominance peaked at 5,815.2, followed by a strong correction that has broken the green bullish channel and is now moving within a bearish channel (red lines). Currently, the price is at 4,027.6, just testing a key support zone and still within a short-term downtrend.
The RSI is at 47.6, neutral zone, indicating that there is still no clear oversold condition, but selling pressure remains present. The MACD, although still in positive territory, shows a potential bearish crossover forming, which could anticipate further declines if the current support is broken.
📈 Projection for the coming days
If dominance continues to fall, we are likely to see a capital flow toward altcoins, which would generate a possible mini altseason in the short term. Conversely, if it strongly rebounds at this support, Bitcoin could absorb liquidity again, causing corrections in the rest of the market.
💡 Conclusion
The BTCDOM is like the thermometer of the crypto weather: if it rises, Bitcoin strengthens and altcoins weaken; if it falls, altcoins breathe and grow. The current moment is one of extreme vigilance, because we are at a point that could define the course of the entire market in the coming days.
📌 Follow me for more strategic analyses and market readings that help you trade with an advantage in this ever-changing crypto world.
