


This selected article is translated from Frederik Theissen's (Inferring Leveraged Positioning from Price and Open Interest) by Benpaocaijing·Web3.0 Research Lab.
By analyzing price and open interest (OI) with the Leveraged Position Opening and Closing (LPOC) indicator, real-time leverage trends in the cryptocurrency market can be revealed. It identifies market tops, bottoms, and systemic risks more accurately based on superior funding rates and clearing data.
I. Understanding Crypto Market Leverage Dynamics
New Method for Position Tracking
Leverage is a core feature of the cryptocurrency market, driving and exacerbating booms and busts. Derivatives (especially crypto-native perpetual contracts) often trade volumes far exceeding spot, amplifying market sentiment and volatility.
Understanding how traders enter and exit leveraged positions is crucial for assessing short-term price movements and identifying macro market trends.
Traditionally, the industry relies on liquidation data and funding rates to assess leverage and positioning. However, these indicators have significant shortcomings:
1. Liquidation Data: Although widely used, it only captures forced liquidations, reflecting only a small portion of total position changes. In addition, exchange reporting standards vary (some platforms delay or lack data), and its ex-post nature limits its real-time decision-making value.
2. Funding Rate: Measures the cost of holding a position based on the perpetual-spot price spread, reflecting the net position direction. However, it lags in reacting to market upheavals, fails to reflect the scale of position adjustments, and may remain subdued during significant deleveraging events.
*Typical case: During a large-scale long liquidation, if spot and perpetual prices fall synchronously, the funding rate hardly changes, even though positions are significantly liquidated. Similar delays exist during short squeezes.
To address the above shortcomings, this article introduces the Leveraged Position Opening and Closing (LPOC) indicator, which infers position changes by analyzing the relationship between price and open interest (OI).
Unlike traditional indicators, LPOC provides a more immediate and comprehensive view of leverage dynamics, using OI data to capture active and forced position changes in all types of market conditions.
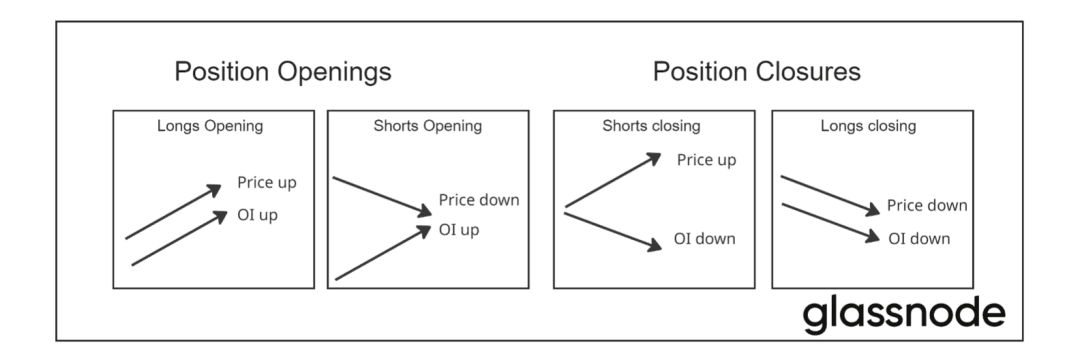
The POC method is based on the interaction between price trends and OI (tracking all outstanding derivative contracts). Analyzing the link between the two can infer four types of position behavior (see Figure 1):
1. Long Opening: Price and OI rise simultaneously, and traders increase long exposure in an uptrend.
2. Short Opening: Price decreases accompanied by an increase in OI, indicating that traders are opening short positions.
3. Long Covering: Price and OI decline synchronously, showing that long positions are being unwound.
4. Short Covering: Price increases accompanied by a decrease in OI, indicating that short positions are being exited.
The basic assumption of the LPOC indicator is that, on average, OI reflects positions mainly composed of opening trades that follow mainstream price movements.
This means:
· An increase in OI during price increases usually corresponds to newly opened longs;
· An increase in OI during price declines suggests newly opened shorts;
· When OI and price trends diverge, closing behavior can be inferred.
This method is asset class-agnostic and applicable to all assets with available OI data, providing a consistent analytical perspective across different markets. The signal processing flow is as follows: calculate the short-term trends of price and OI, and then derive a comprehensive indicator through the product of trend values to reflect the consistency of direction.
Note that, due to differences in market participation and the inherent long bias in the crypto market, the magnitude of short signals (short openings/closings) is often much lower than that of long signals. Therefore, we provide a standardized version of the indicator to ensure comparability and highlight the relative strength of all types of positions.
II. Bitcoin Insights: Marking Tops and Bottoms
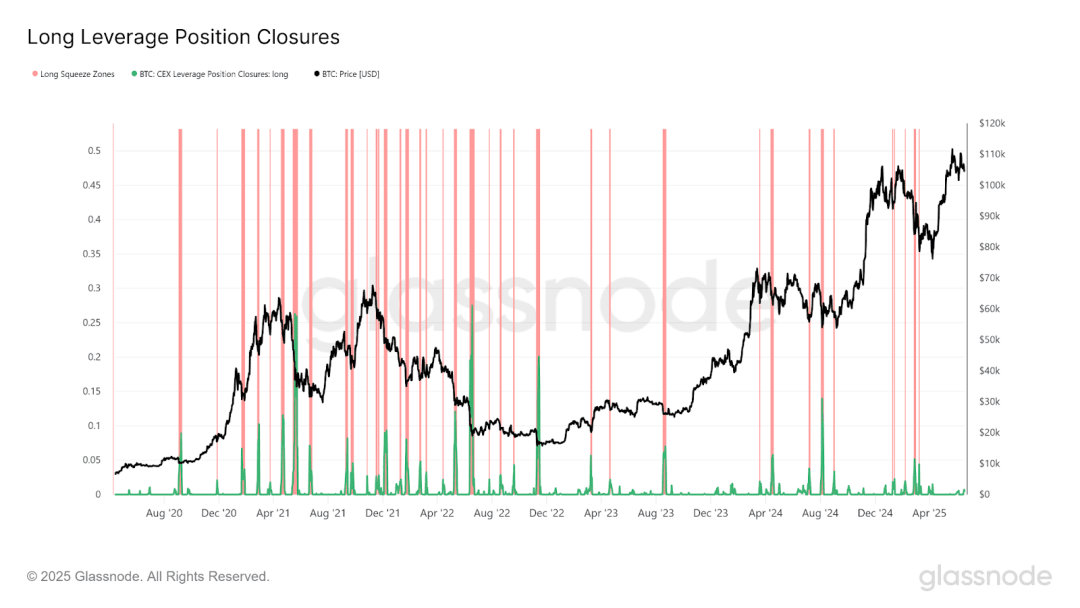
The green line shows the Bitcoin long liquidation signal, and the red shaded area represents the period when the signal exceeds the set threshold (long squeeze area), indicating increased liquidation activity. The black line is the logarithmic price of Bitcoin (USD, secondary axis).
Applying LPOC to Bitcoin reveals clear patterns that highly correlate with historical market turning points. Figure 2 clearly shows that long liquidations often mark local bottoms after price declines. This is especially evident during periods of sustained rallies (such as June 2020 to mid-2021 and late 2022 to present), where the signal precisely identifies multiple local lows. This is particularly noticeable when observing the red shaded areas (which often coincide with lows).
The higher the signal strength, the more significant the accuracy, indicating that extreme deleveraging events increase the probability of price rebounds. This is consistent with the view that 'forced deleveraging creates market inefficiencies by accelerating selling'.
III. Identifying Market Frenzy and Bubbles
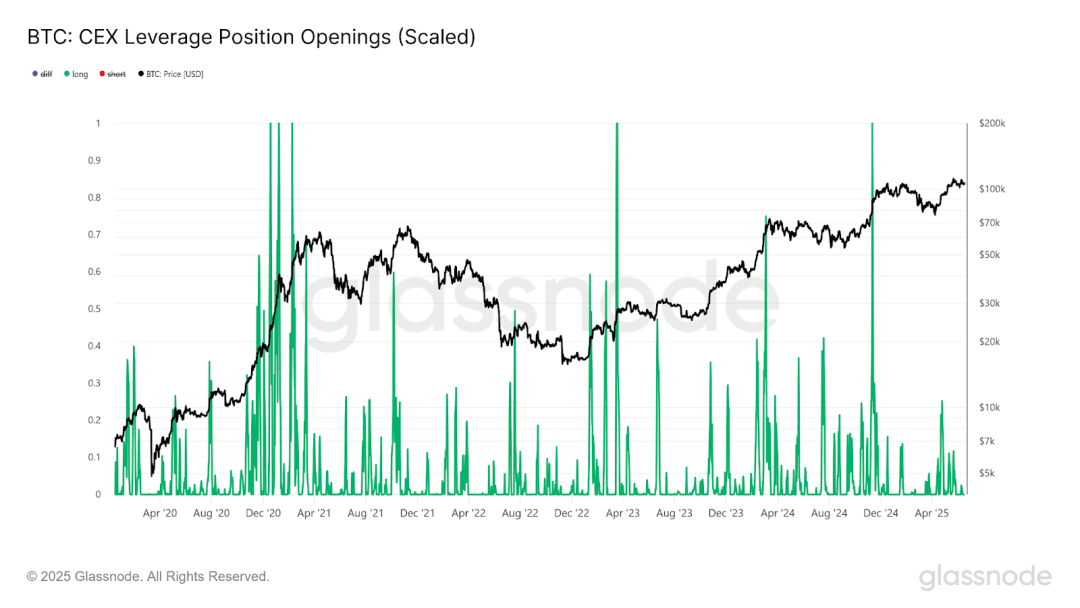
Figure 3 shows that surges in BTC long positions often mark frenzy and bubble areas. Significant long opening periods often appear before or during market tops, reflecting trader over-optimism. This accumulation of long exposure often foreshadows a potential reversal zone, and the market often tops out after the surge, highlighting the value of LPOC in identifying high-risk areas.
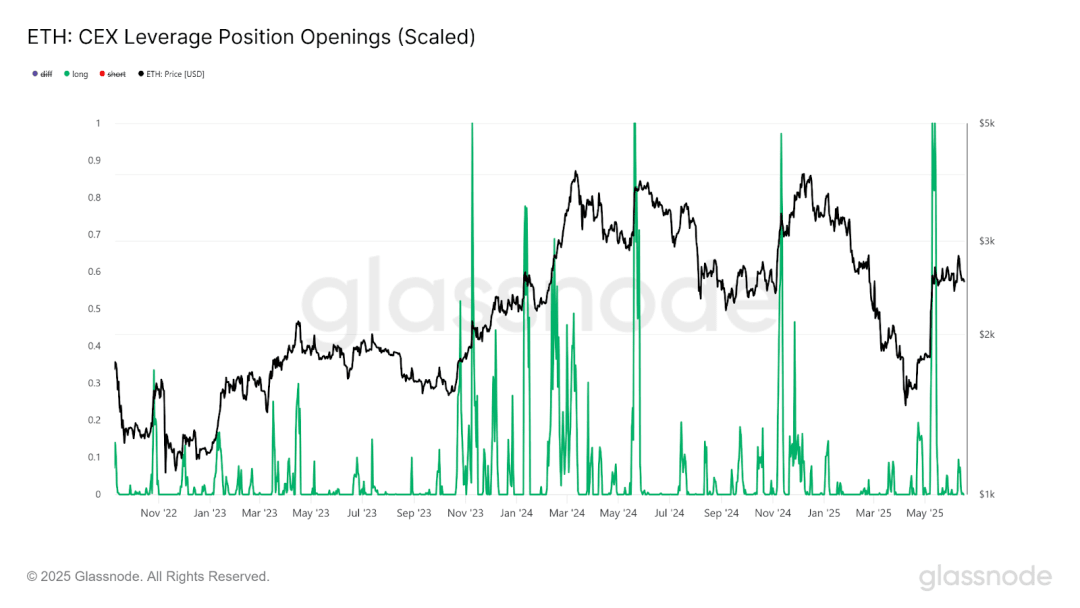
The pattern is clearer when applied to ETH (Figure 4). A surge in long openings also leads or closely follows market tops. Markets tend to top out shortly after long exposure expands, confirming the signal's consistency across assets and its value in predicting excessive positions.
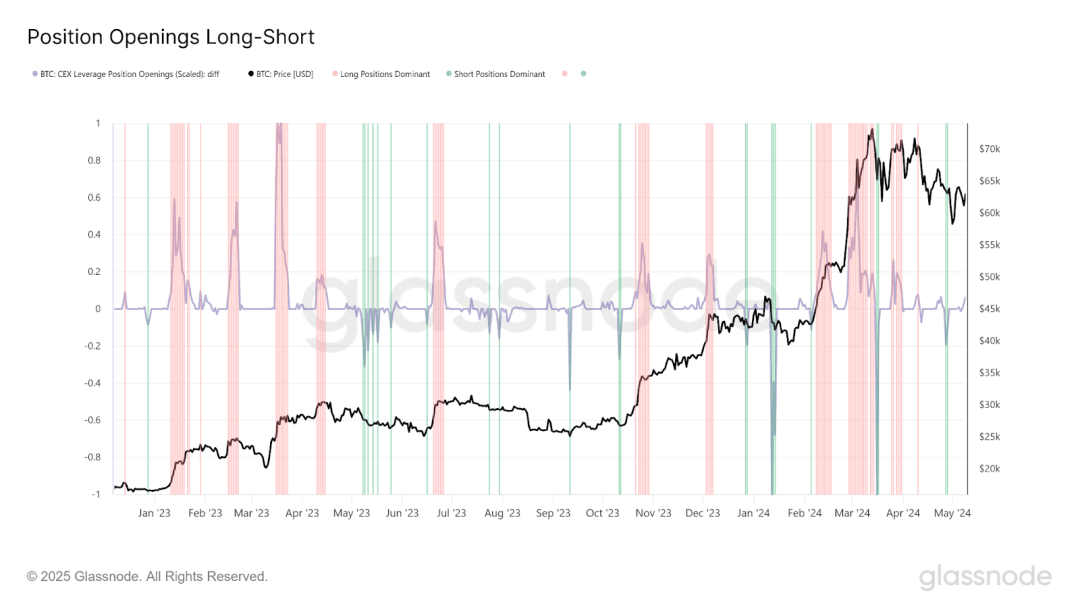
The difference between long and short position openings (standardized long openings minus standardized short openings) highlights the dominant market sentiment. Figure 5 visualizes this difference, with red/green shaded areas (based on set thresholds) indicating periods of long/short dominance, respectively.
Typically, long positions surge during price increases, and short positions peak during price declines. This is consistent with the nature of the LPOC indicator: when OI rises, it detects long openings in uptrends and short openings in downtrends.
However, a key finding is that when position strength peaks and declines, the trend often reverses, foreshadowing potential market turning points.
IV. Market Analysis and Narrative Construction
The LPOC indicator provides a granular perspective on understanding dominant positions in key market events. A typical case is the FTX collapse in November 2022, which can be traced back through the position dynamics of BTC and SOL.
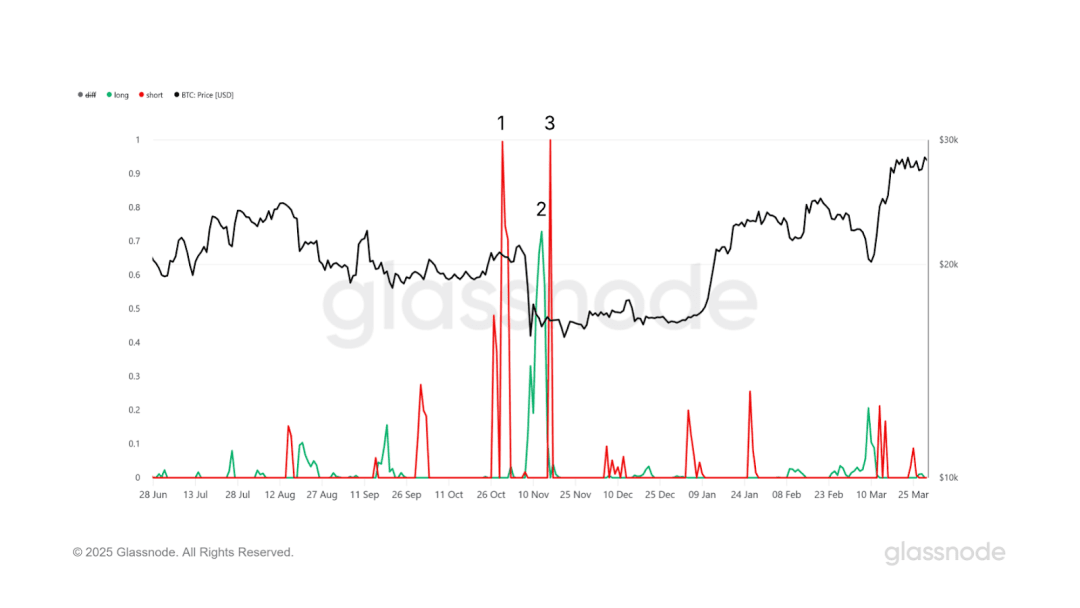
The green line represents long covering, the red line represents short covering, and the black line represents the price of Bitcoin (USD, secondary axis). Marked events (1, 2, 3) highlight key liquidation sequences.
For BTC (Figure 6): before the collapse, the price ended consolidation and slowly moved upward, with Event 1 showing the initial short covering. The collapse on November 5, 2022, triggered a surge in long liquidations (Event 2), reflecting panic exits and liquidations amid the price crash. During the market rebound, shorts opened during the decline were squeezed, leading to forced liquidations (Event 3).
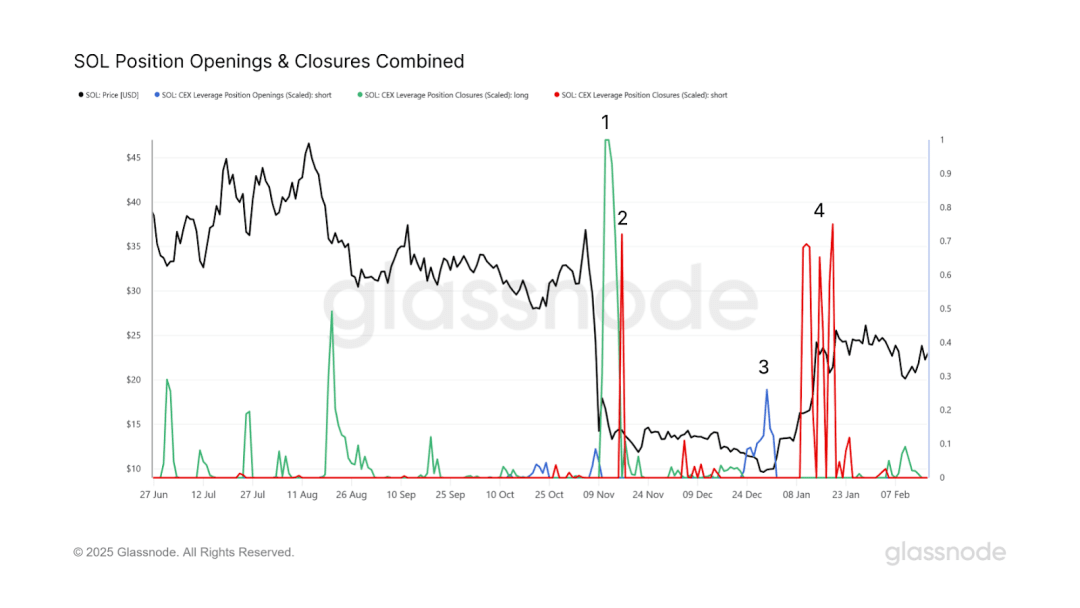
For SOL (Figure 7): The LPOC indicator presents a significant pattern during the same period. SOL's
FTX collapse price plummeted, and a large number of longs were liquidated when it fell below $10 (Event 1 in the figure). During the market recovery, shorts opened during and after the collapse (not shown) were squeezed, followed by short openings (blue event peak 3), and rapidly and repeatedly covered when SOL broke through $20 within a few days (event peak 4).
SOL's clear short squeeze cycle confirms the indicator's ability to track specific market responses, showing how misaligned dominant positions amplify volatility and reveal trading behavior under pressure. The repeated short squeezes during SOL's over 100% gain in about a month also expose the limitations of LPOC: it can only identify one dominant position pattern at a time.
This recurring misalignment (markets on average building exposure in the wrong direction) highlights the value of the LPOC tool in interpreting market narratives and identifying opportunities for inefficiency created by leverage dynamics.
V. Cross-Asset Perspective
Market-wide Deleveraging Wave
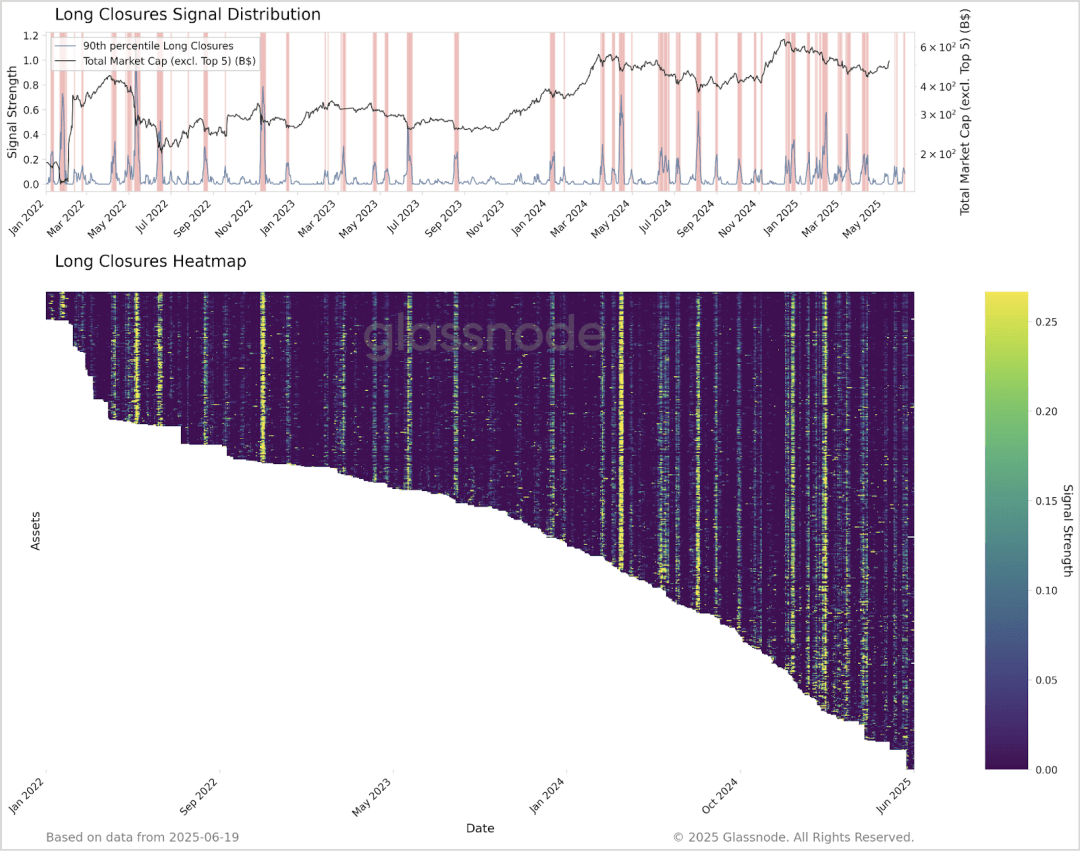
Visualizes the 90th percentile leverage signal combined with total market capitalization (excluding the top five coins). Red shaded areas indicate periods when the 90th percentile signal exceeds 0.01, potentially signaling market-wide position adjustments. The heatmap below shows the temporal and cross-sectional distribution of the signal.
Extending LPOC analysis to hundreds of crypto tokens, Figure 8 shows the heatmap and leverage ratio 95th percentile. This view reveals significant patterns: during systemic deleveraging events (such as May 2021, November 2022), long liquidations of various assets often occur synchronously.
Such synchronized spikes foreshadow large-scale deleveraging, often coinciding with market-wide local lows and the dissipation of bubbles. The synergy of cross-asset long liquidations highlights its role as a leading indicator of market-wide stress and recovery.
Deleveraging events become healthy market mechanisms by clearing out excess leverage, but also create inefficiencies by exacerbating price declines due to panic liquidations. This regularity in the crypto market makes it a potential entry point or opportunity for traders.
VI. Practical Application
The LPOC indicator provides several actionable insights:
· Bottom Building
High long liquidation signals often foreshadow high-probability entry points after capitulation.
· Top Risk Management
A significant surge in long openings indicates overly aggressive longs, suggesting potential risk.
· Short Squeeze Detection
A rise in short openings followed by short covering may precede a short squeeze-driven rebound.
· Market Health Monitoring
Cross-asset view highlights systemic leverage trends, aiding portfolio risk assessment.
VII. Considerations and Future Improvements
| Time Resolution Limitations
LPOC excels at observing position changes over weeks/months but lags behind intraday/weekly changes. Future versions could be designed to provide higher-resolution market position views.
| Winner-Take-All Classification
LPOC identifies a single dominant signal and misses coexisting position behaviors in volatile markets. Future iterations can calculate the probability of all position types, providing a more granular view of competing positions.
| Integration with Auxiliary Indicators
Combining LPOC with exchange flow data or social media sentiment can enhance its ability to distinguish liquidation-driven liquidation from profit-taking and detect market manipulation. Hybrid models will improve accuracy.
VIII. Conclusion
The Leveraged Position Opening and Closing (LPOC) indicator provides a valuable tool for interpreting the leveraged dynamics of the crypto market. By examining the correlation between price and open interest, it provides a real-time, cross-asset view of trader positions under changing conditions.
Compared to liquidation data and funding rates, LPOC provides more comprehensive and timely insights, helping to identify market tops, bottoms, short squeezes, and systemic shifts.