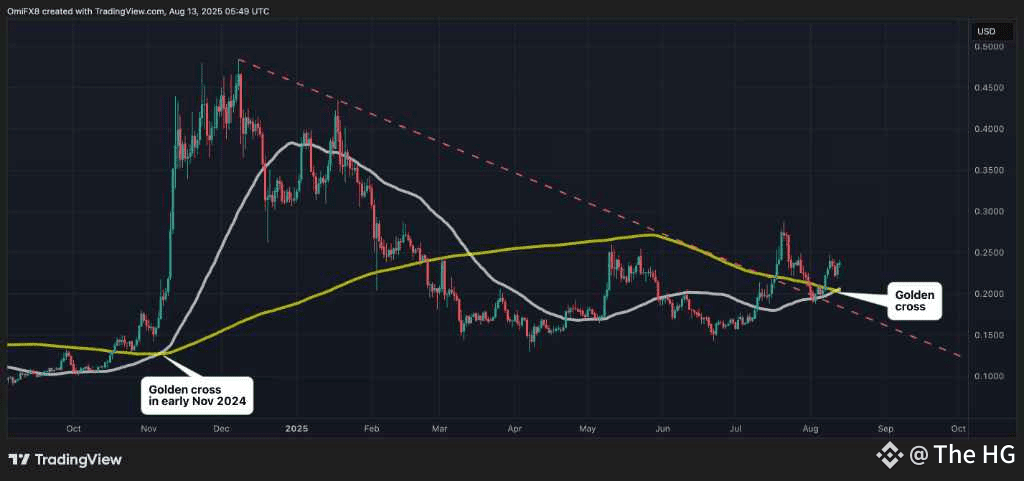
What it is: A golden cross is a bullish chart pattern. The 50-day moving average just crossed above the 200-day moving average.
Why it matters: This signals a potential long-term uptrend. It suggests that recent buying momentum is strong enough to reverse a longer decline.
What to watch for: A key resistance level is around $0.25. Breaking above this could confirm the signal and fuel a rally.
Important reminder: This is a lagging indicator. It confirms a trend that's already in motion. Always use other metrics and be aware of the risks in a volatile market.