
The price of Solana (SOL) fell 4.3% in the last 24 hours. Although this may seem like a routine pause after recent gains, on-chain activity tells a more cautious story.
Both short-term and long-term investors are positioned in ways that historically signal limited rallies, and the price chart is showing a structure that often precedes deeper corrections. Learn more by continuing to read!
Short-term investors are in profit-taking territory
Short-term investors in Solana have relatively high unrealized profits, with the STH-NUPL (Net Unrealized Profit/Loss) currently at 0.093. This number is close to the levels observed from May 10 to 13, when the price of SOL corrected from $183 to $131. This elevated NUPL suggests that short-term investors are in the hope/fear zone, where taking profits becomes more tempting.
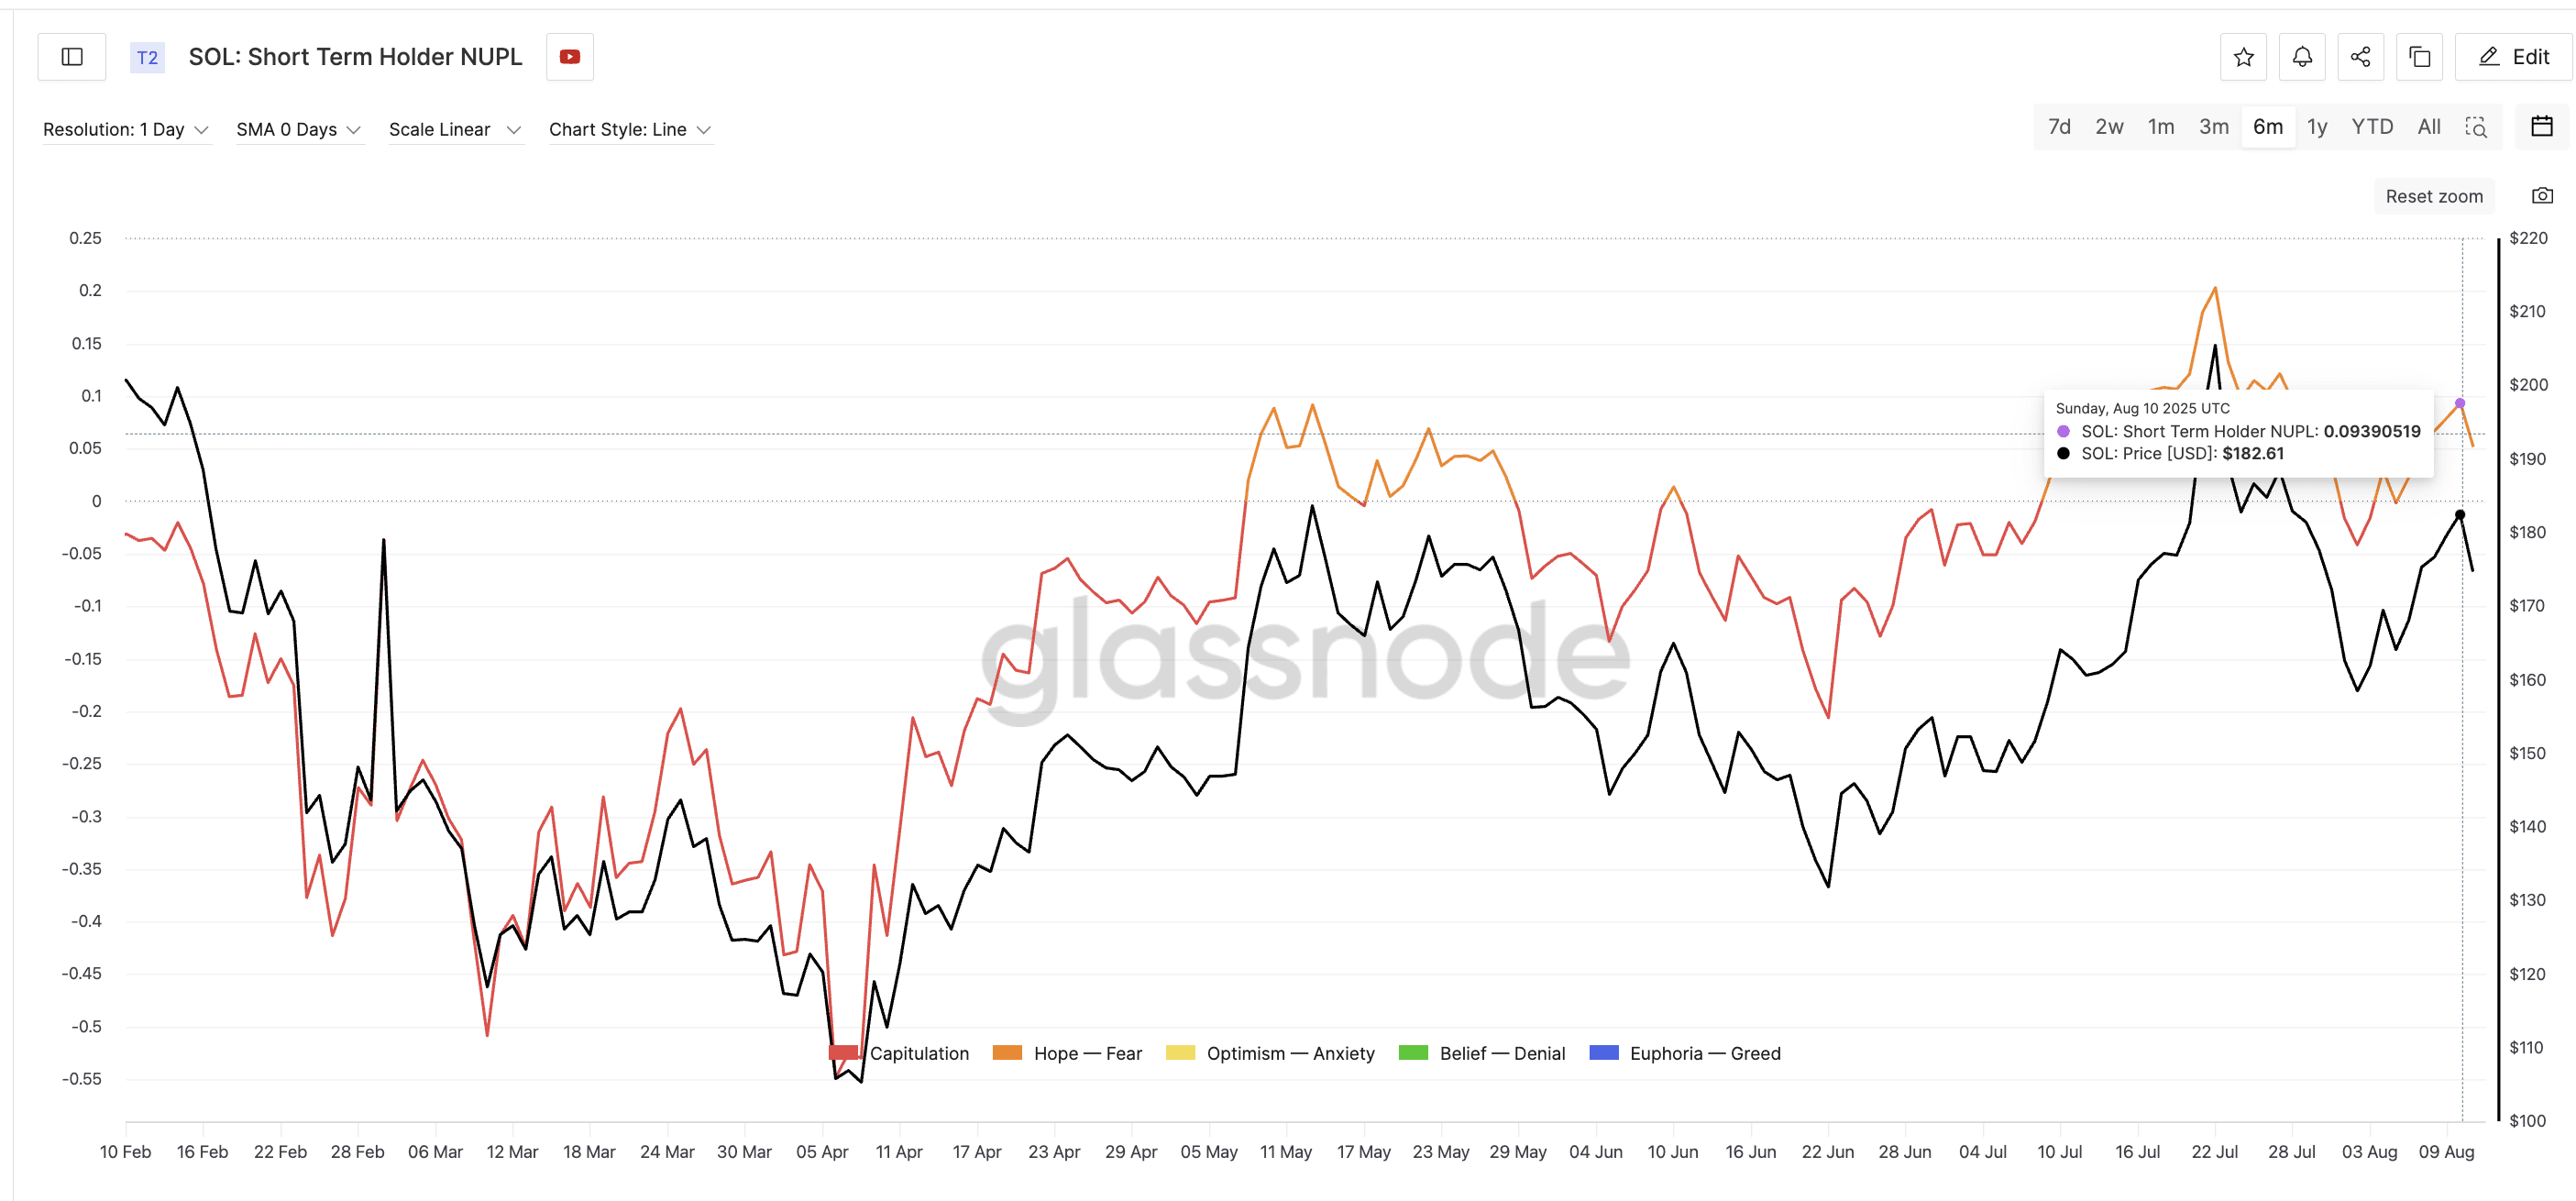 Price of Solana and NUPL of short-term investors: Glassnode
Although this metric does not directly confirm that investors are selling, it highlights an environment where profit-taking becomes more evident, especially if price momentum stagnates. The reading is still below extremes, suggesting that the market is not overheated, but remains high enough to warrant caution.
The STH-NUPL measures the average unrealized profit or loss of coins held by short-term investors. High readings mean that investors are in profit and may be more likely to sell.
Long-term investors reduce positions
If short-term investors create immediate selling risk, long-term investors set the tone for the strength of the downtrend. Recently, they have been reducing positions; a subtle but important signal. The price of Solana, over the last month, has responded whenever the net position metric changed. Prices fell when the metric fell and vice versa.
The Net Position Change metric of Hodlers, which tracks the monthly net accumulation or distribution of long-term investors, has been declining for several weeks. This means that long-term investors are selling more than buying, showing less willingness to hold during this resistance zone.
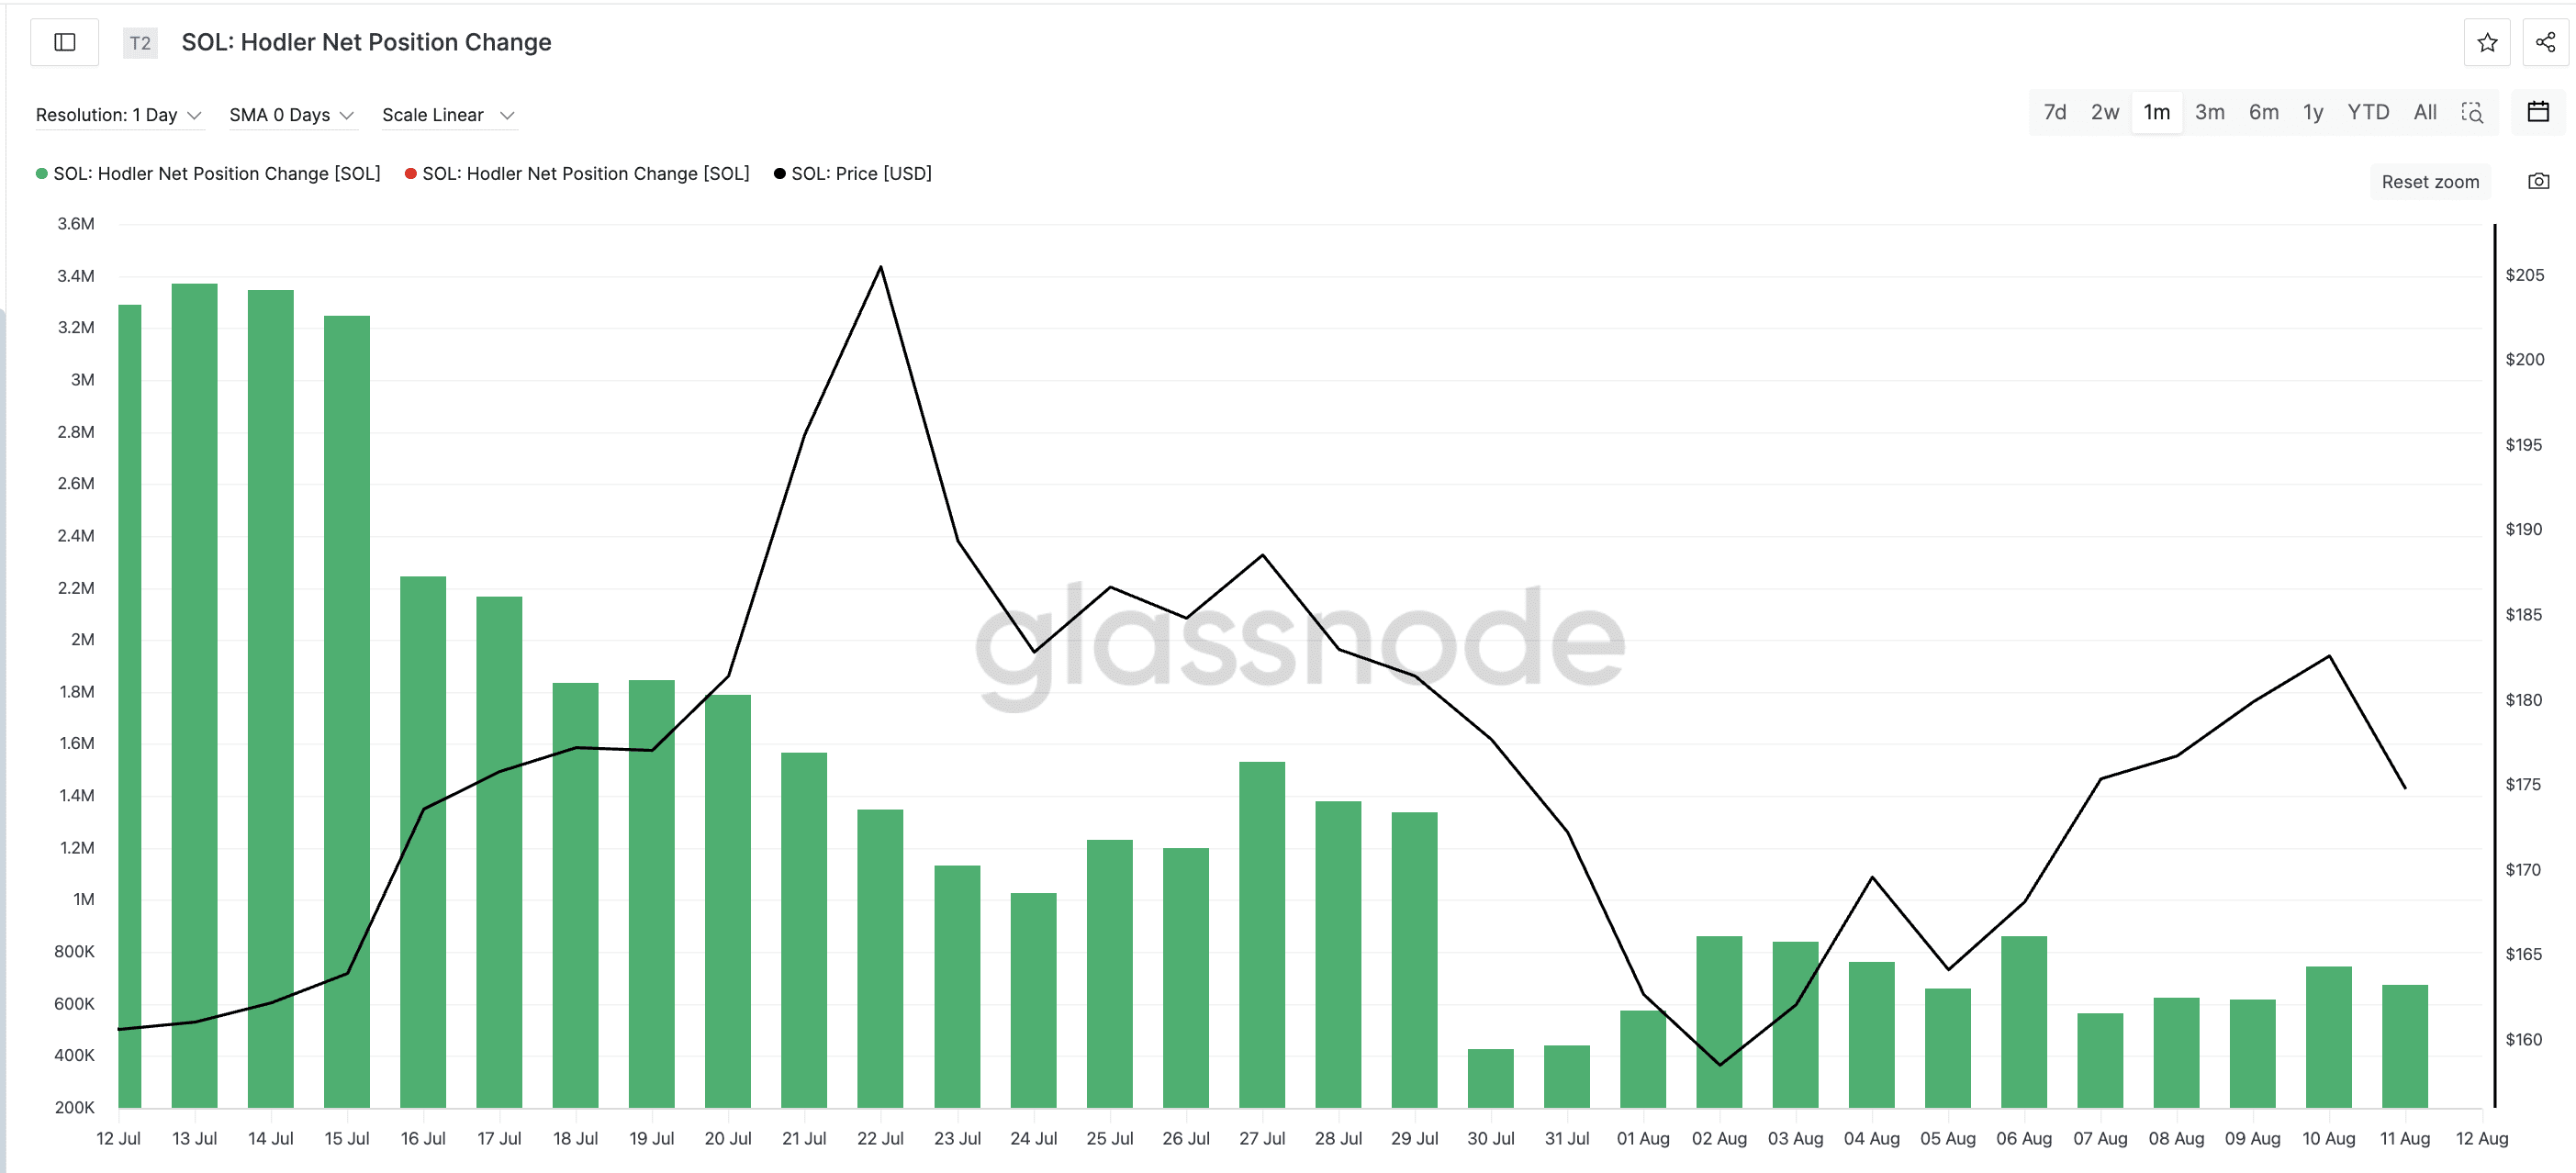 Price of Solana and net position change of Hodlers: Glassnode
This behavior often limits upside potential because it removes the support of strong investors that sustains the price of SOL during pullbacks. Combined with the elevated NUPL of short-term investors, it creates a scenario where both groups can increase selling pressure instead of absorbing it.
Two-day chart shows price compression of Solana in a downtrend
The price action of Solana is reinforcing what on-chain data suggests. Over a two-day period, Solana is forming a descending triangle — lower highs pressing against a flat support base.
This pattern is often seen in distribution phases, where rallies disappear earlier and the risk of a breakdown increases. Over a longer period (2 days), in this case, the risk of a breakdown increases.
A descending triangle is a bearish technical pattern that forms when sellers consistently limit the highs while buyers defend a fixed support level. The pressure usually resolves downward if support fails.
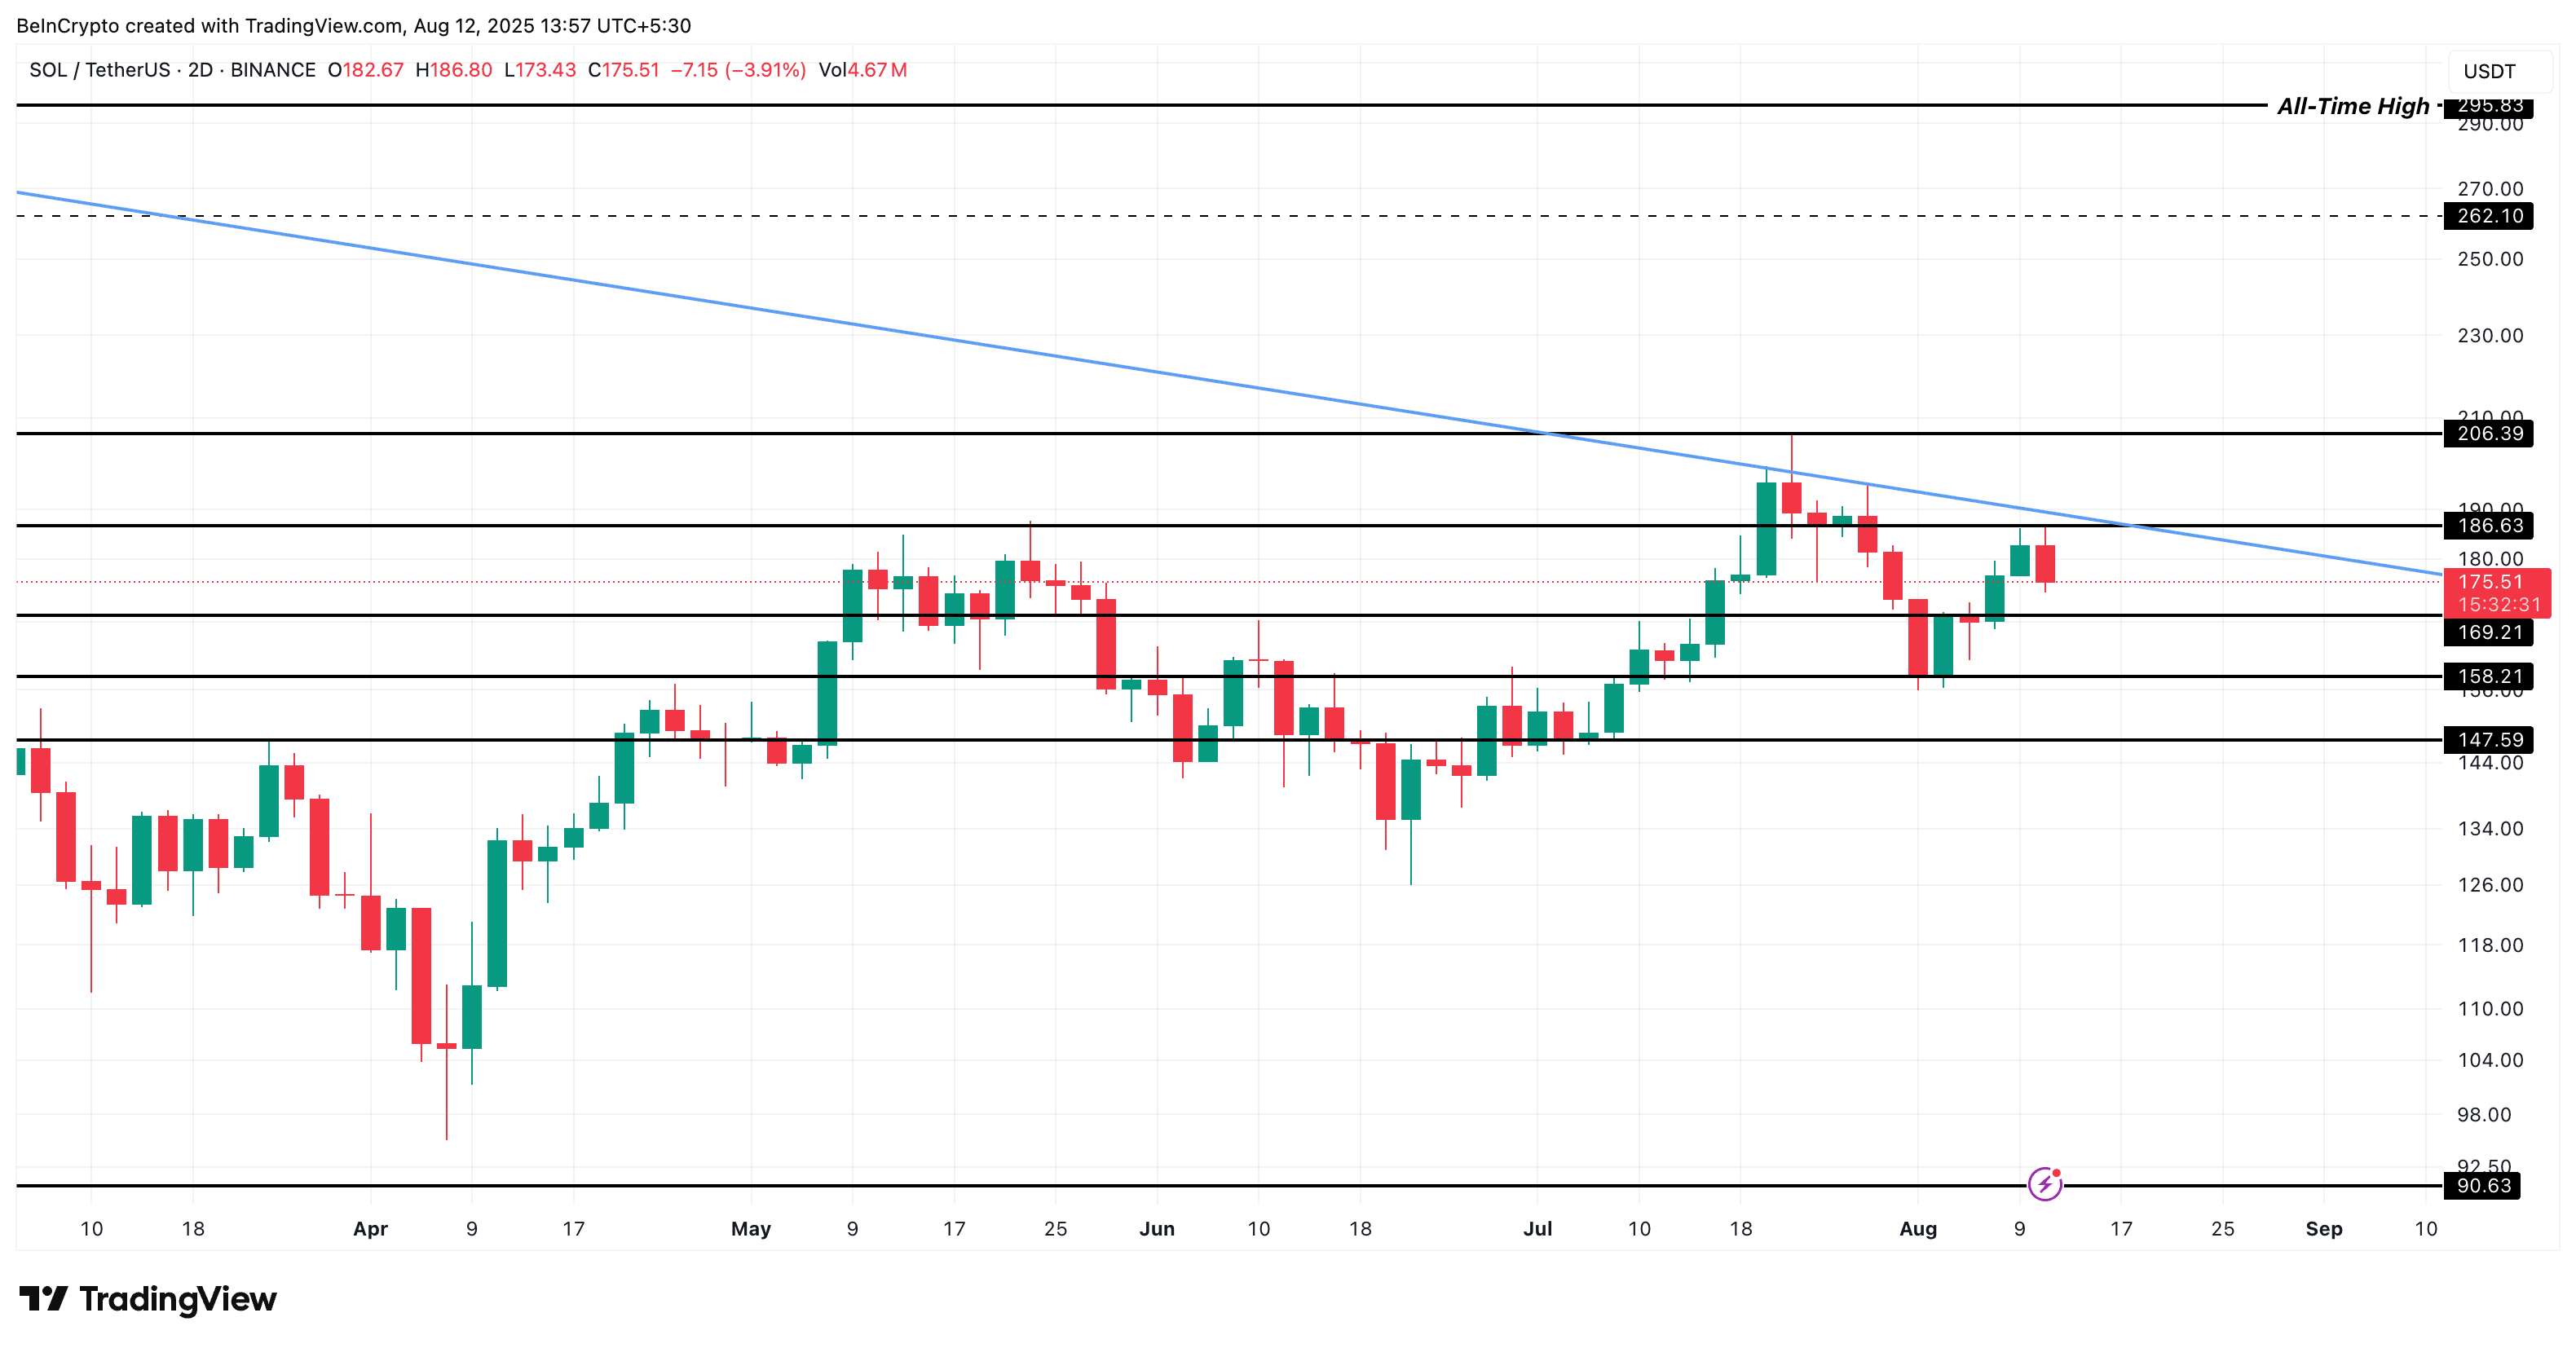 Price analysis of Solana: TradingView
Immediate resistance to invalidate the bearish pattern remains at $186, with key support levels at $169 and $158. A close below $158 would confirm a breakdown of the triangle, potentially paving the way for a deeper decline. The $147 level makes the entire bearish structure in the medium term.
The bearish scenario would weaken if SOL breaks and closes above $186, ideally accompanied by a drop in short-term investor NUPL and a return to net accumulation by long-term investors. This would signal that selling pressure is decreasing and could pave the way for a retest of $205.
The article Solana faces upside limit with profit-taking risk was first seen on BeInCrypto Brazil.

