📈 Bullish Candlestick Patterns 🌟
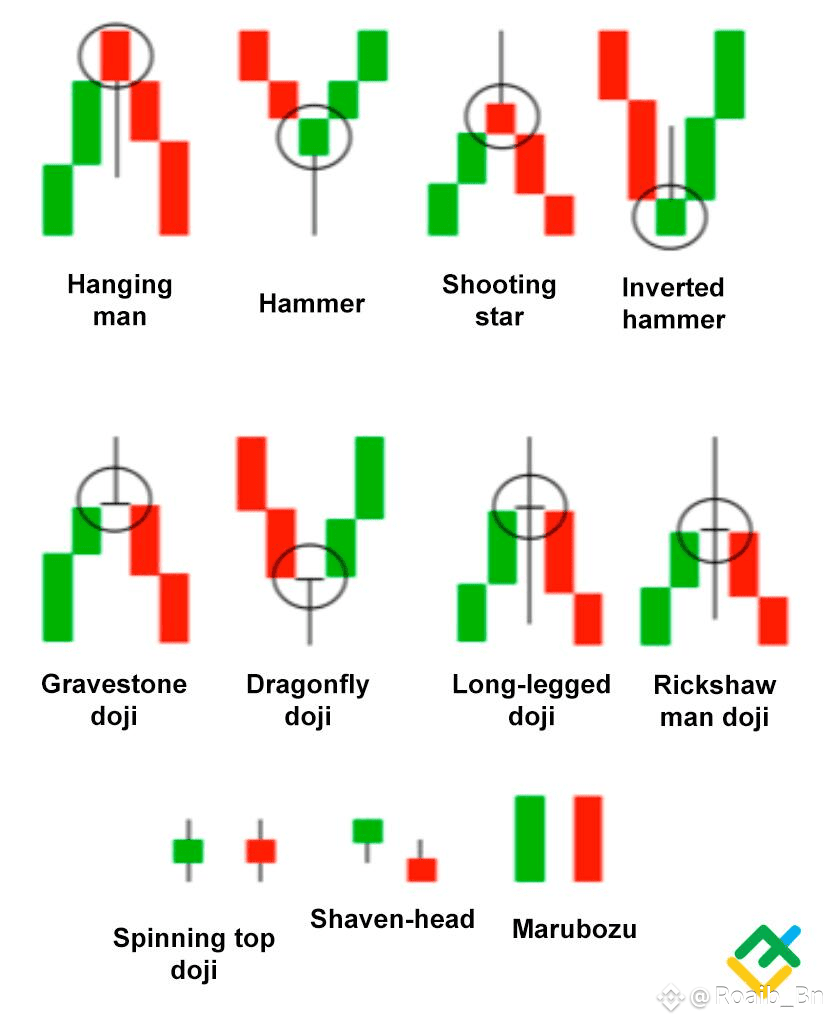
1️⃣ Hammer 🛠
Appears after a downtrend 📉
Long lower shadow + small body = buyers stepping in 💪
2️⃣ Inverted Hammer 🔨
Signals possible reversal after a downtrend
Long upper shadow showing buyer interest ✨
3️⃣ Bullish Harami 🤰
Small green candle inside previous red candle’s body
Indicates weakening selling pressure 🔄
4️⃣ Morning Star 🌅
3-candle pattern: Red ➡️ Small (doji/spinning) ➡️ Green
Strong bullish reversal signal 🚀
5️⃣ Dragonfly Doji 🐉
Long lower shadow + no upper shadow
Buyers rejected lower prices aggressively 💥
---
📉 Bearish Candlestick Patterns ⚠️
1️⃣ Shooting Star 🌠
Appears after uptrend 📈
Long upper shadow = sellers pushing back hard 🛑
2️⃣ Hanging Man 🪢
Same shape as hammer but after an uptrend
Warns of a possible reversal to downside 🔻
3️⃣ Bearish Harami 😈
Small red candle inside previous green candle’s body
Weakening buying pressure 📉
4️⃣ Evening Star 🌌
Opposite of Morning Star
3-candle formation signaling downtrend ahead 🚨
5️⃣ Gravestone Doji ⚰️
Long upper shadow, no lower shadow
Bears rejected higher prices aggressively 💣
---
💡 Pro Tip: Combine candlestick patterns with volume, trendlines, and support/resistance for better accuracy ✅
📊 If you found this guide helpful, Like ❤️ | Comment 💬 | Follow ➕ for more trading education!
HERE is the candles image 👇
IF you find the post helpful then please follow like and comment on it thanks 👍
#DeFiGetsGraded #CPIWatch #BTCOvertakesAmazon #BTCReclaims120K #ETHTreasuryStrategy