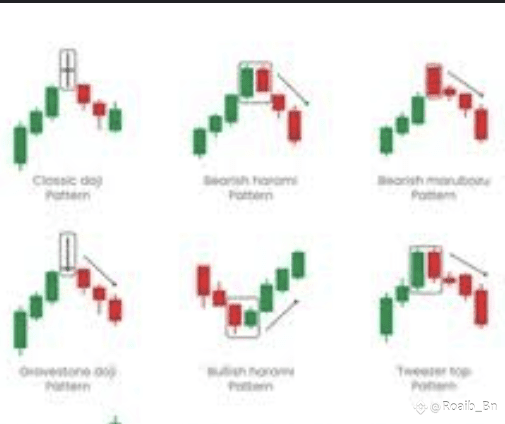
1️⃣ Classic Doji Pattern ⚖️
Shows market indecision.
Often signals a trend reversal when found at the top or bottom of a move.
---
2️⃣ Bearish Harami Pattern 🐻📉
A small red candle inside the previous green candle’s body.
Indicates weakening buying pressure and a possible downtrend ahead.
---
3️⃣ Bearish Marubozu Pattern 🚨📉
A strong red candle with no shadows.
Signals high selling pressure—often a continuation of the downtrend.
---
4️⃣ Gravestone Doji Pattern 🪦📉
Open, low, and close prices are the same with a long upper wick.
Shows that buyers tried but failed—bearish reversal sign.
---
5️⃣ Bullish Harami Pattern 🐂📈
A small green candle inside the previous red candle’s body.
Suggests buying interest returning—possible uptrend coming.
---
6️⃣ Tweezer Top Pattern 🔪📉
Two candles with the same highs after an uptrend.
Indicates strong resistance and potential reversal downwards.
---
💡 Pro Tip:
Candlestick patterns work best when combined with volume analysis 📊 and support/resistance levels 📏.
📌 Save this guide and share it with your trading friends! 🙌
If you found this helpful, follow, like & comment to spread the knowledge. 💬🔥
HERE is the candles image 👇
IF you find the post helpful then please follow like and comment on it thanks 👍
#DeFiGetsGraded #CPIWatch #BTCOvertakesAmazon #BTCReclaims120K #ETHTreasuryStrategy
