The crypto market has recently shown a divergent trend, with Bitcoin entering a consolidation phase after a high-level correction, while Dogecoin continues to be constrained by key resistance levels, but the long-term bullish structure remains unchanged.
#Bitcoin: Aiming at the resistance of $120,500 after correction, with clear support levels
Bitcoin's price has recently corrected part of its gains in the
$122,250 area and is currently in a consolidation phase. Looking back at the trend, BTC previously found support near $115,500, breaking through $117,500
the dollar, resistance levels such as $118,800, reached a high of $122,273, then pulled back and fell below the
50% Fibonacci retracement level from the low of $116,282 to the high of $122,273, while also breaking below the key bullish trend line at the support level of $119,500 on the hourly chart.
The current price stands firm above $118,000
and is above the 100-hour simple moving average. Short-term upward resistance is clear: direct resistance is near $119,250, while key resistance is at $120,500.
— If the closing price breaks through this level, BTC is expected to restart its upward trend, further challenging $121,250, $123,200, and even moving towards the target of $125,000.
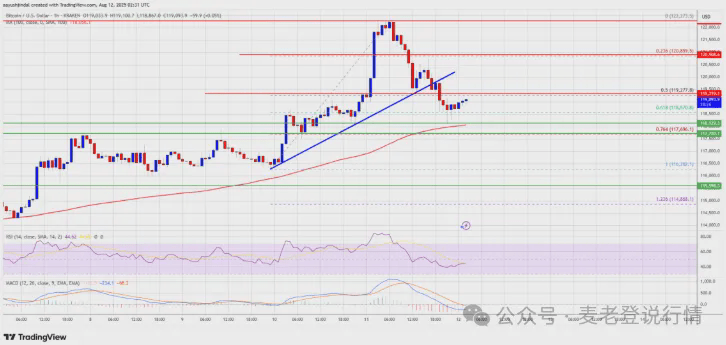
In terms of downside risk, if it fails to break through
the resistance at $120,500, it may pull back again. Immediate support is at $118,200, with major support levels at $117,800 and $116,550.
the dollar, if it further declines, may test $115,500 in the short term, with key support at $113,500. Technical indicators show that the hourly MACD
is weakening in the bullish zone, with the RSI falling below the 50 level, requiring attention to subsequent volume changes.
#Dogecoin: Three times blocked at $0.30, long-term upward channel remains unbroken
Dogecoin is currently challenging the $0.30 resistance for the third time, this level has repeatedly become a 'roadblock' for price increases this year. Historical trends show that after failing to hit $0.30 in March, the price fell to $0.17; after briefly rising to $0.26 in May, it pulled back again;
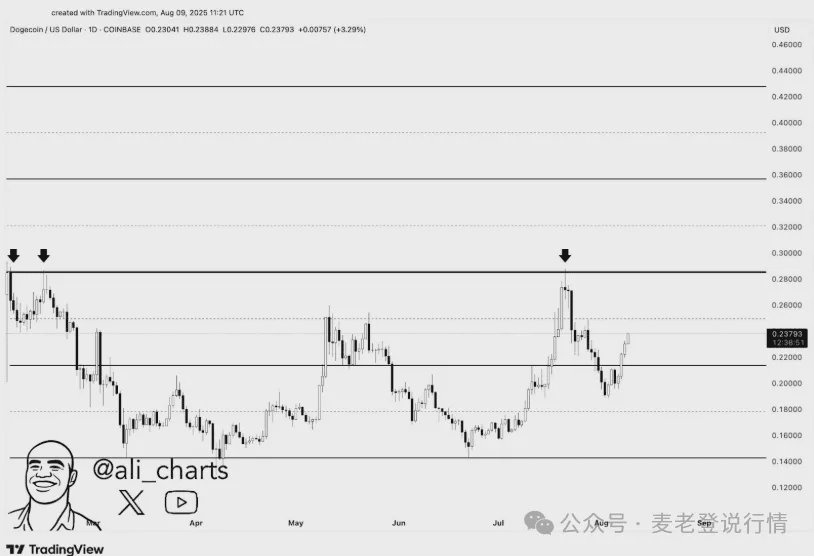
After breaking through $0.26 in early July, it approached $0.30, but the resistance remains strong, then fell back to the support level of $0.21, currently trading around $0.23669, positioned between the support of $0.22 and the resistance of $0.26.
In the long term, Dogecoin has always been within a wide upward channel since 2014, with significant increases in 2017, 2021, and 2024 starting near the lower edge of the channel. The peak in 2021 reached $0.73665, and the pullback did not break below the lower limit of the channel. The current price is near the midpoint of the channel (approximately $0.21768), and the bullish structure remains intact.
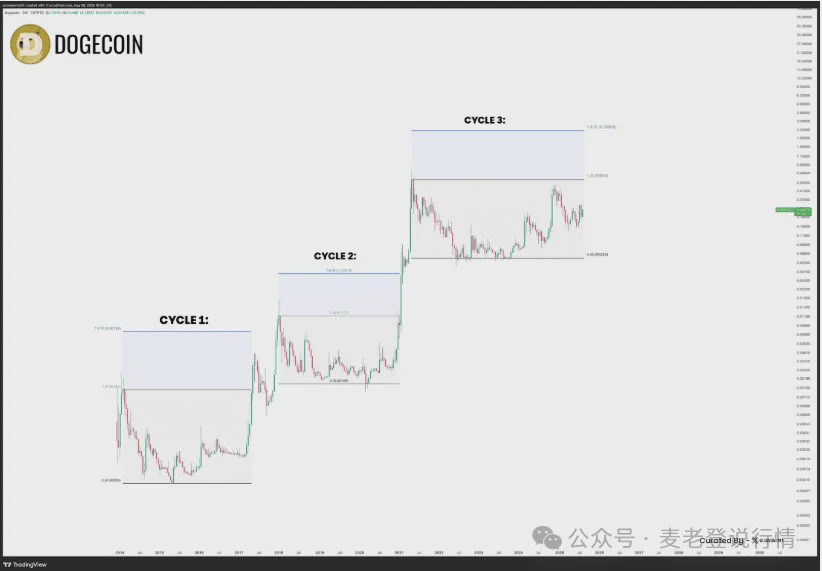
Cycle analysis shows that its historical peaks often touch the 1.618 Fibonacci extension of the cycle lows, and the current target for the third cycle of $2.22806 has yet to be tested.
Short-term momentum indicators show signs of cooling: on the 4-hour chart, the momentum from the rise from $0.18 to $0.275 at the end of July has weakened, with highs moving lower and trading volume shrinking; although the MACD remains positive, the gap between the lines is narrowing; the RSI has dropped from the overbought range of 72.68 to 64.99, indicating reduced buying pressure.
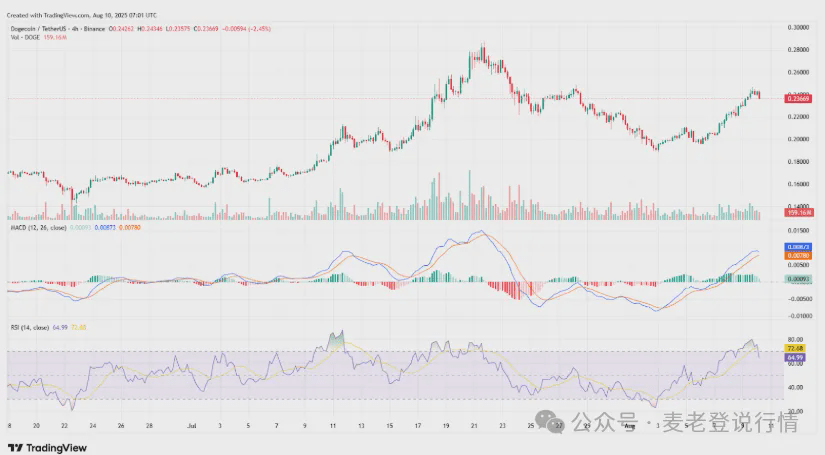
However, the DOGE/BTC currency pair has risen 11.60% this month to 0.00000202 BTC, with long lower shadows reflecting ongoing support demand.
To summarize
In the short term, Bitcoin needs to focus on the breakout situation of the $120,500 resistance, while support defense will determine the depth of the pullback; Dogecoin needs to break through the $0.30 resistance to open up upward space, with long-term channel support providing a buffer. Investors need to closely track volume and indicator changes to seize potential breakout opportunities.

