Welcome back to our updated Elliott Wave Count for Bitcoin.
Apologizes for not publishing an update yesterday, I caught a cold over the weekend so I wasn't in a good position to do a proper analysis :( We try to post a daily BTC update and occasionally EW counts for other coins too :) Going to try to keep that style up but no promises got to see how it works out.
We have seen a strong move up from our support area as we expected.
Today we got another count on the charts which doesn't mean that the other count (diagonal) we have been discussing throughout the last week is invalid. More on that later this analysis.
In this count we assume that the move up isn't a diagonal but rather multiple 1-2 set ups.
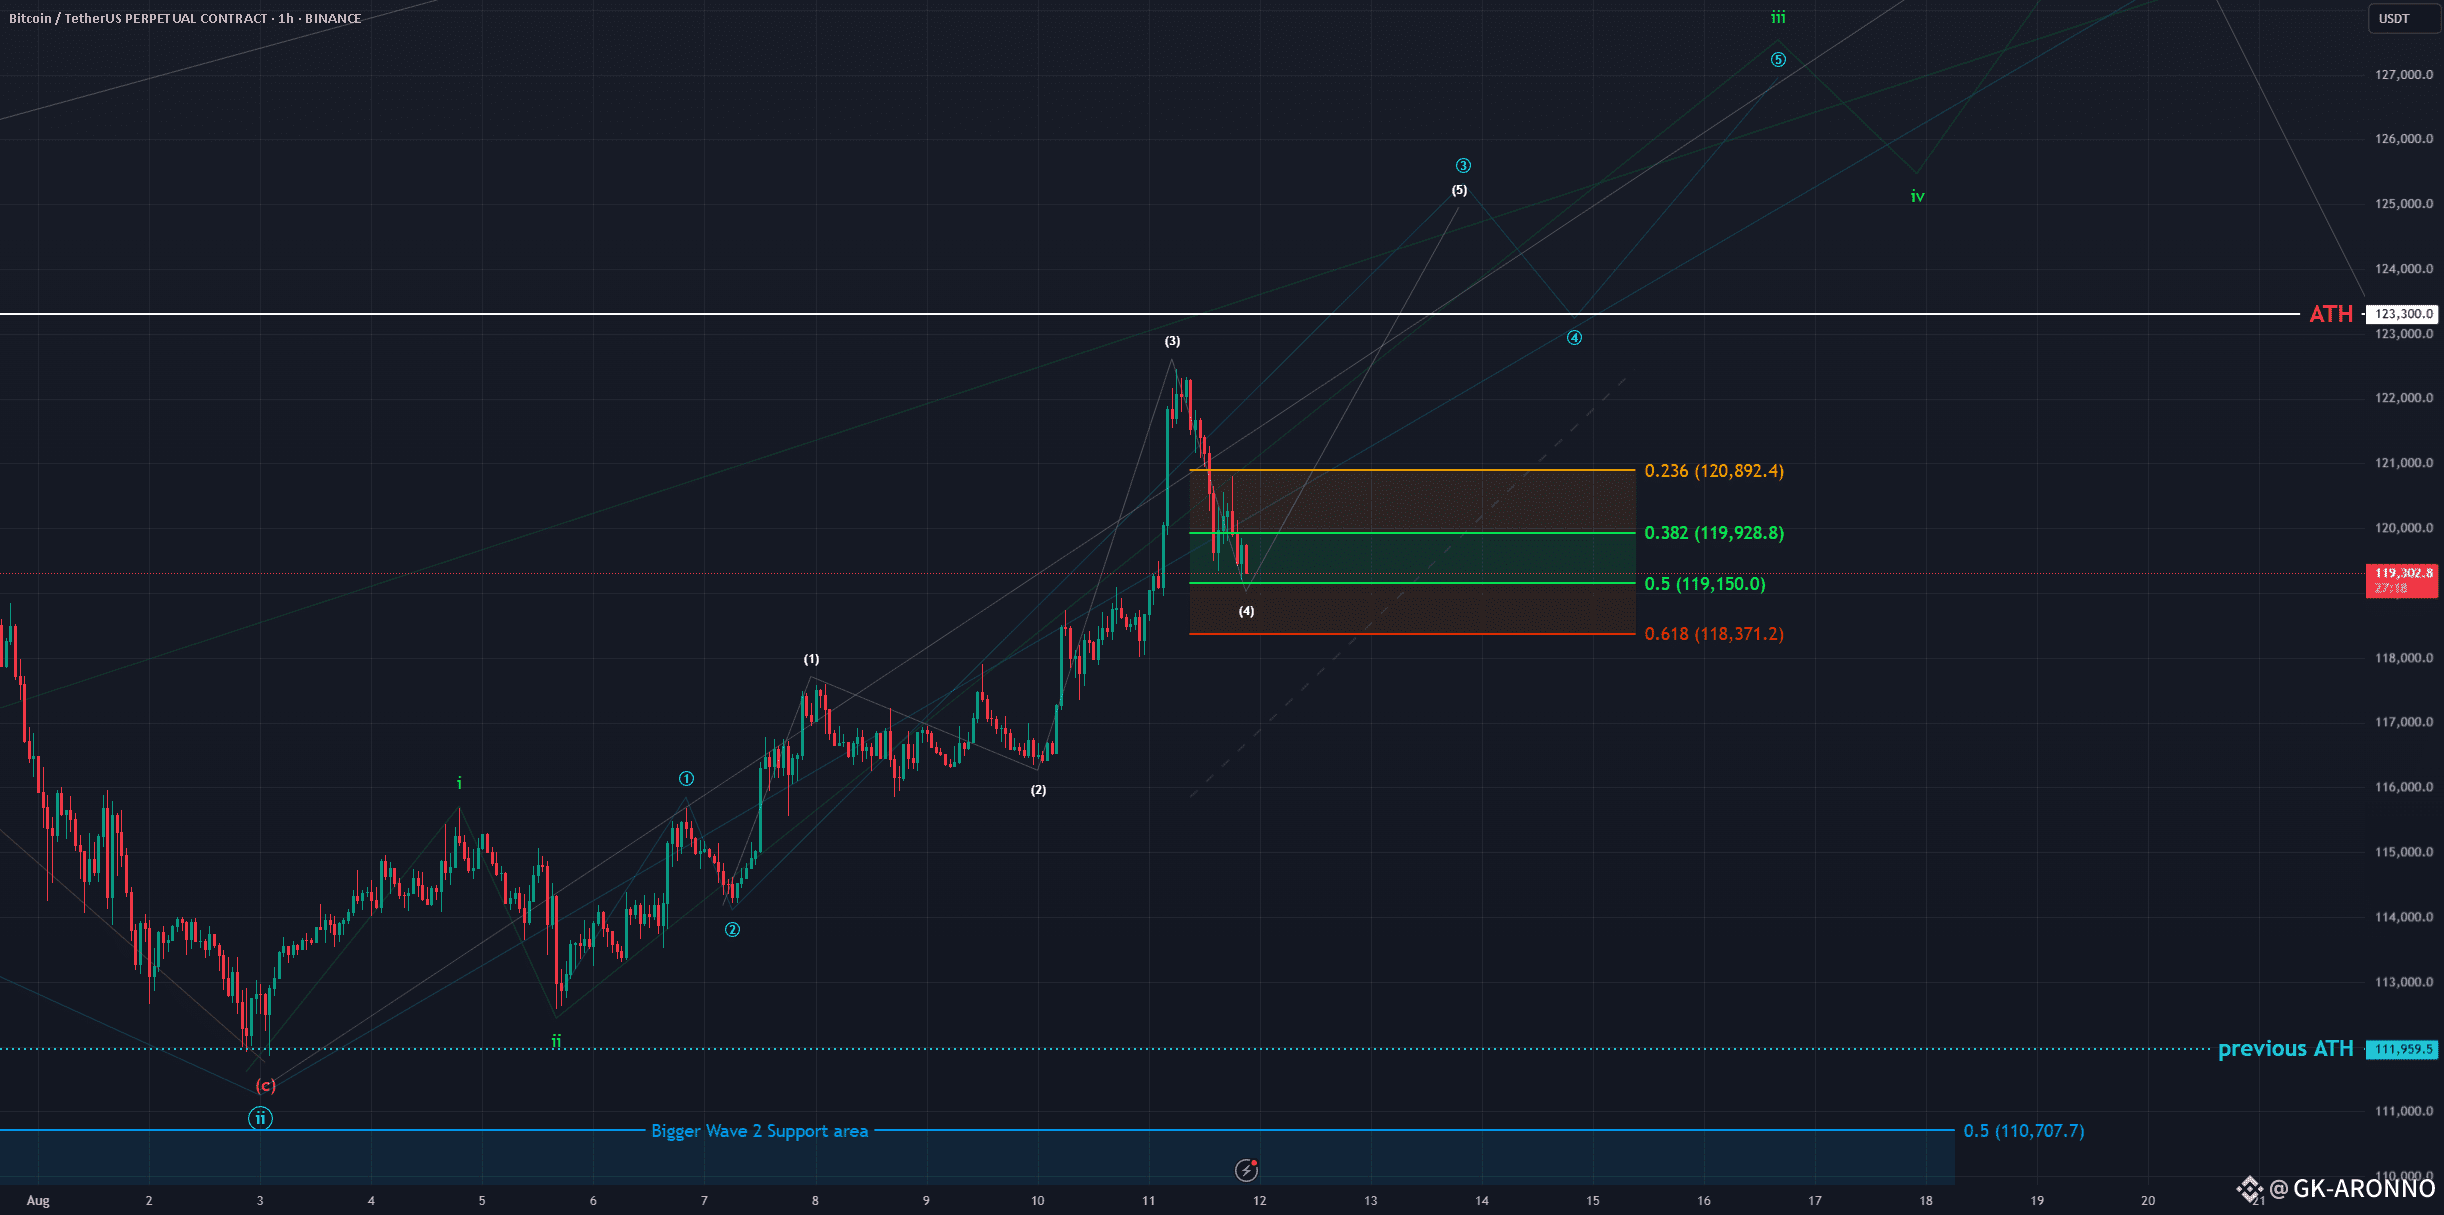
This count allows us to go higher more directly with a strong Wave 3. We got three 1-2's, a green one, a blue and a white one on the chart. We assume that the recent aggressive push was the white Wave 3 and we're now seeing a pullback in white Wave 4 which will be followed by the white Wave 5 which finishes the blue Wave 3 etc.
The support area for the white Wave 4 is between the 0.236 FIB at 120'892 USD and the 0.5 FIB at 119'150 USD. Preferably we would see a bounce from here now in this count as we have already entered it and tested the 0.5 FIB of the support area which Bitcoin seems likes to be doing recently. In case we go lower it could be that the white five move is already done but we'll see how it develops. The blue Wave 4 support area would be around 118'000 USD to 120'500 USD.
As above mentioned this doesn't invalidate the diagonal count. It is hard to distinguish between multiple 1-2's and a diagonal. We lean towards the multiple 1-2's count because the last move up was impulsive and aggressive. If you connect the Wave 1 and 3 high you get a trendline which can be overshot by the 5th Wave in a diagonal in a such called "throw-over" which usually comes with high volume which we indeed had here. The issue is we are looking for a leading diagonal and this throw-overs are more common in ending diagonals which is the main reason for the switch of the counts. :) Hope it makes it more transparent and understandable!
I just want to make aware that with this counts we got multiple support areas which are close to each other or even overlap. Essentially the whole price range of 114'000 USD to 121'000 is important, preferably we still want to bounce from the mentioned support area above but what we want to make aware of is that a break of it doesn't turn the count bearish. Just keep that in mind when trading on smaller timeframes :)
We would appreciate a follow and boost if you like the analysis! :)
Thanks for reading.
NO FINANCIAL ADVICE.