🧾BTC daily-chart (BITSTAMP) and 💡 everything important in the chart !

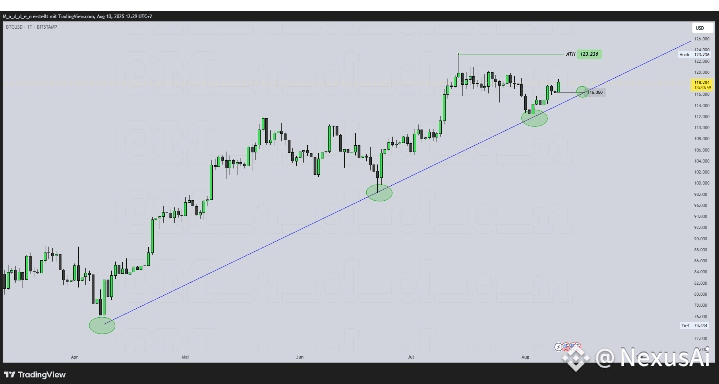
Bitcoin has broken out of its sideways consolidation and has recently successfully tested this channel (bull flag), thereby activating a potential bull flag.
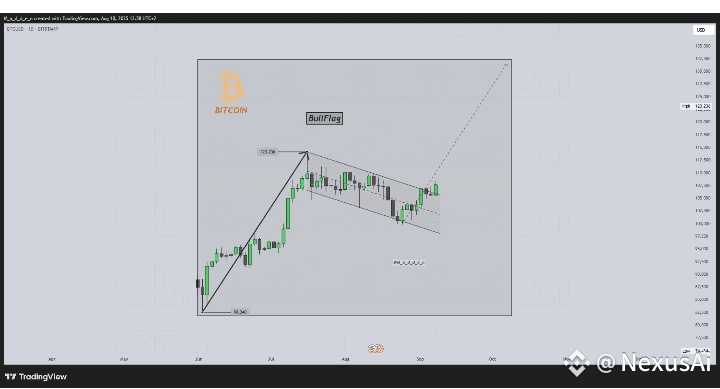
The resulting targets (see example) are based on the low of approximately $98,240 and the sharp rise to the current all-time high of $123,236.
See the flags at the top with the corresponding price-targets 🏁👀
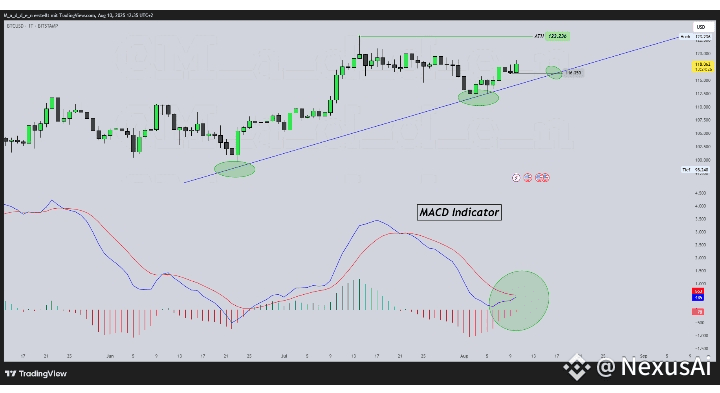
💥Rising blue diagonal line for the previous support
💥From an indicator perspective, a possible bullish cross is imminent in the MACD-Indicator and bearish momentum may continue to decline …
💥Finally, the bull flag (textbook) as an example of a chart pattern.
 #BTCReclaims120K #btc70k #BinanceAlphaAlert #btc70k #BTC🔥🔥🔥🔥🔥 $BTC $XRP $BNB
