Most assets in the market show good potential, but there are also some issues

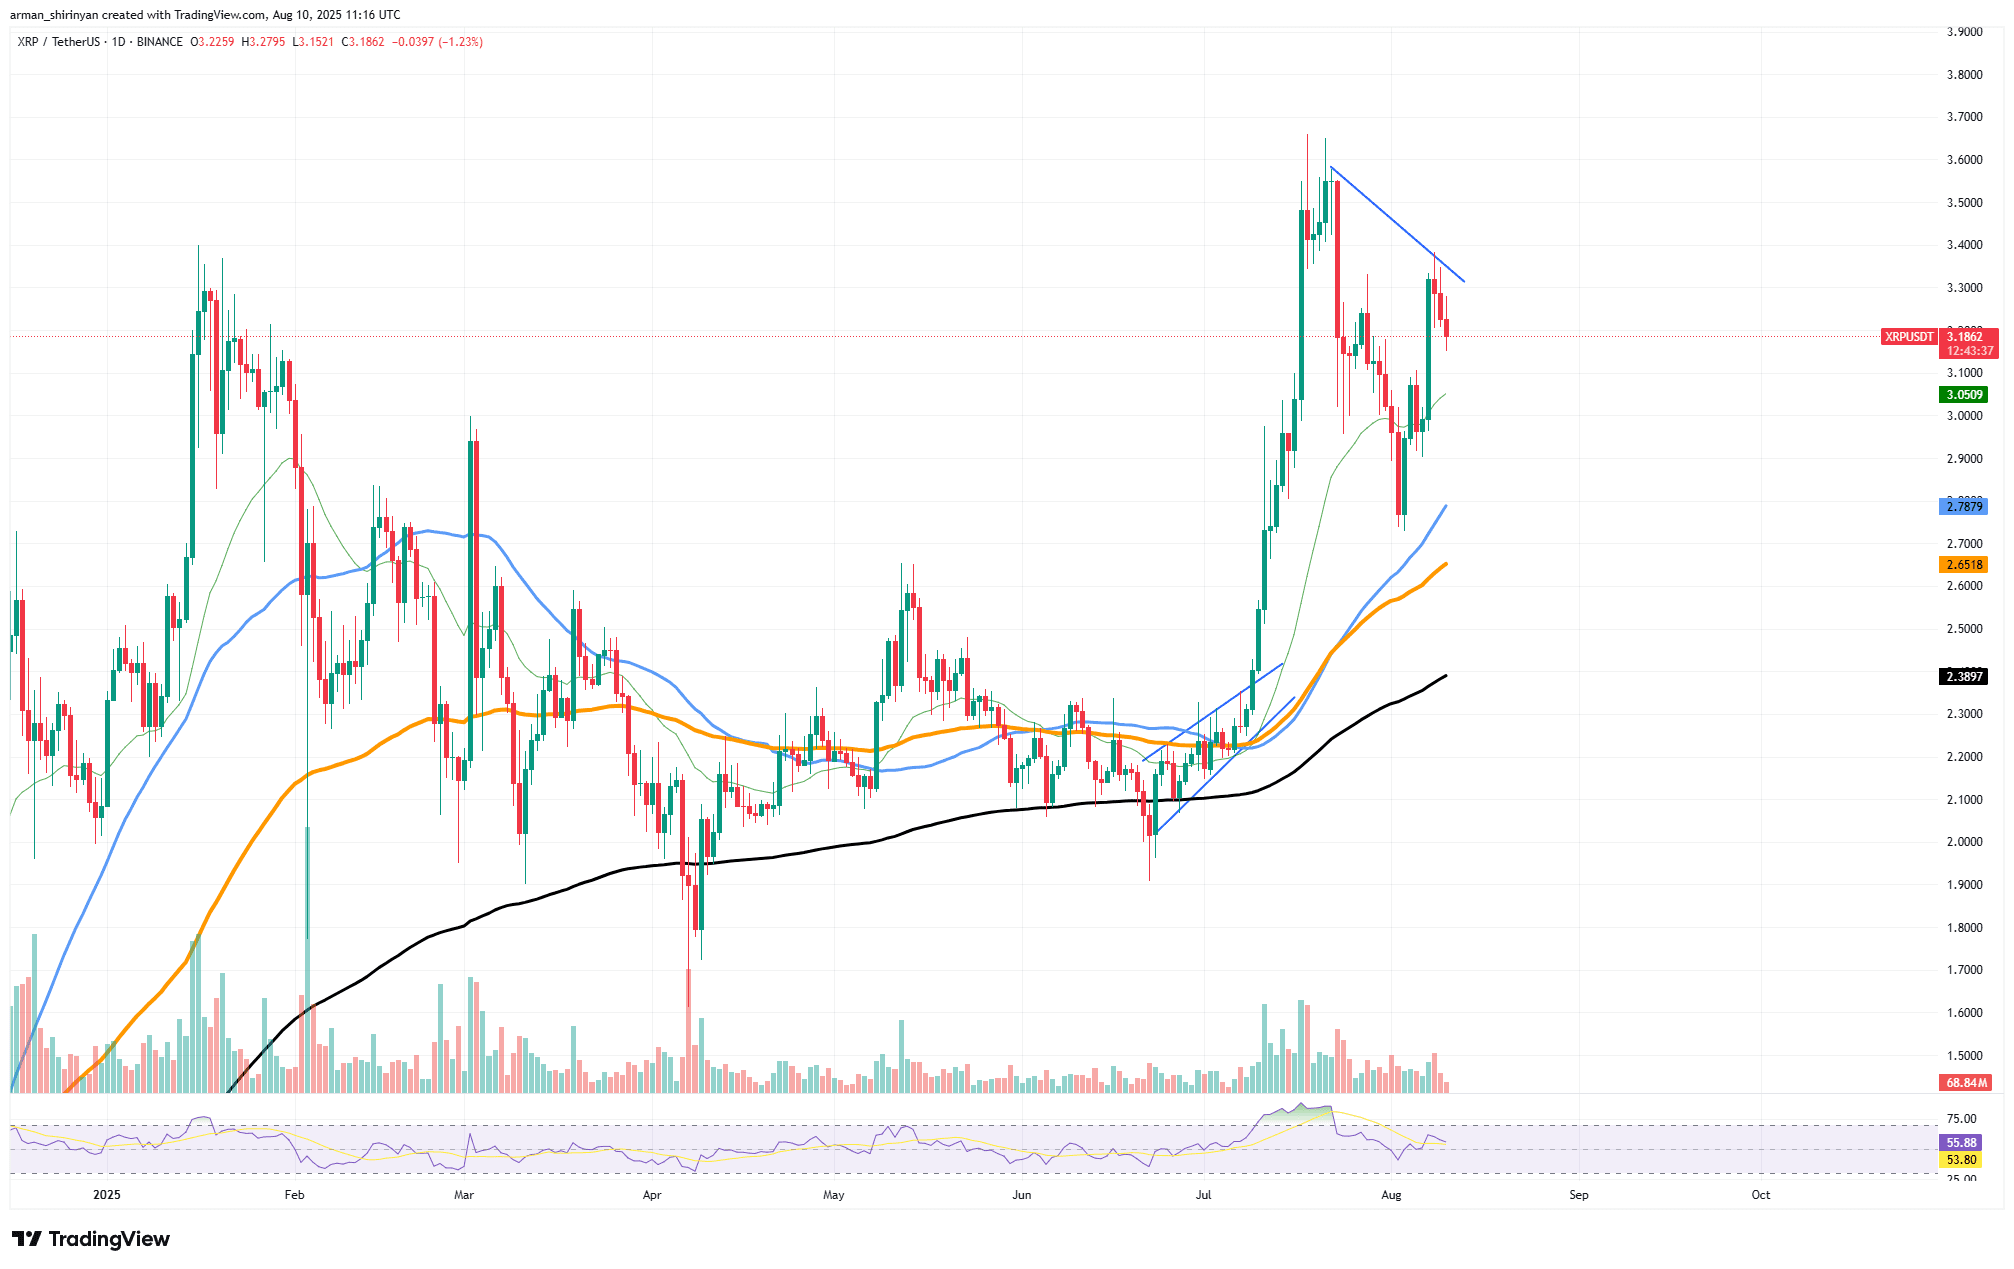
Despite recent volatility, XRP's long-term bullish potential has not been affected, indicating that investors can still target $5. After a strong rebound in July, rising from the $2.40 range to nearly $3.60, the asset is currently consolidating around $3.20. Although momentum has slowed, XRP remains above key moving averages, suggesting its upward trend is intact.
From a technical standpoint, XRP is currently constrained by the upward trend line resistance in the $3.35 to $3.40 range, which has been in place since the late July peak. Bulls are preparing to challenge the $3.60 level again, which is the last significant resistance before the target price levels of $4.00 and even $5.00. Breaking above this level would clearly indicate this trend.
Although short-term price fluctuations and trend line resistance may induce hesitation, the dream of $5 remains alive. To achieve this goal, XRP needs to firmly reclaim the $3.60 area, which would pave the way for a challenge of the psychological $4.00 level, after which $5 will become a feasible benchmark.
Shiba Inu Development
The early signs of a head and shoulders pattern for Shiba Inu (SHIB) are appearing on the daily chart. SHIB has failed to break through the downward trend line resistance that has been in place since the end of July and is currently facing downward pressure, trading near $0.00001338.
After the left shoulder formed at the beginning of July, the price seems to have surged significantly to around the peak or head position of $0.00001550 in mid-July. Although the recent price attempted to rebound from the $0.00001200 region, initiating the formation of the right shoulder, it still struggles to keep up with the combined resistance of the 200-day moving average (approximately $0.00001428) and the downward trend line.
If this pattern materializes, the neckline will be between $0.00001200 and $0.00001220. Since there is more significant support near $0.00001000, and the first major support level is around $0.00001150, a daily close significantly below this level may lead to a deeper sell-off. That said, the bearish scenario is not a certainty. By solidly pushing SHIB above the 200-day moving average and the $0.00001450 resistance level, the bulls still have a chance to invalidate this pattern.
The market may accelerate upward, approaching $0.00001550 and possibly retesting the psychological level of $0.00002000. Although trading volume remains relatively low compared to the July peak, the RSI is currently close to 53, indicating neutral market momentum.
This suggests that traders may be waiting for a breakout or breakdown from this consolidation and are currently in a wait-and-see attitude. Currently, Shiba Inu is at a complex crossroads.
Bitcoin's Attempts
Bitcoin is attempting to rebound from the $120,000 resistance level (which has become a key obstacle for bullish momentum), but it is currently in an uncertain period. In recent weeks, Bitcoin has repeatedly attempted to break through the $118,130 level, but each time has been thwarted by selling pressure, leaving the market in what can be described as 'deep water.'
From a technical perspective, the $120,000 level serves as both a psychological dividing line and a point where the market has previously experienced significant pullbacks. The upward trend of Bitcoin since early May, when it soared from around $95,000 to the July peak, may soon come to an end if not broken. The 20-day moving average (EMA) ($115,964) continues the upward trend and provides some direct support. Next is the 50-day moving average (EMA) ($113,934), corresponding to the consolidation area in early summer this year.
Falling below these levels could bring Bitcoin closer to the 100-day moving average or $108,377, and may further lead to a corrective phase. The recent volume of retesting resistance levels is relatively low, indicating that buyers are cautious about the current high prices. The RSI currently stands at 57, indicating neither extreme bullish nor extreme bearish conditions, suggesting neutral momentum.
If Bitcoin fails to break through and hold the $120,000 level in the near term, it faces the risk of long-term sideways consolidation or even a larger pullback. This would not only suppress market sentiment in the short term but could also delay its comprehensive recovery to historical highs or even higher levels.


