---$ZORA
🚀 ZORA/USDT – Another Accurate Prediction Hits the Mark! 🚀
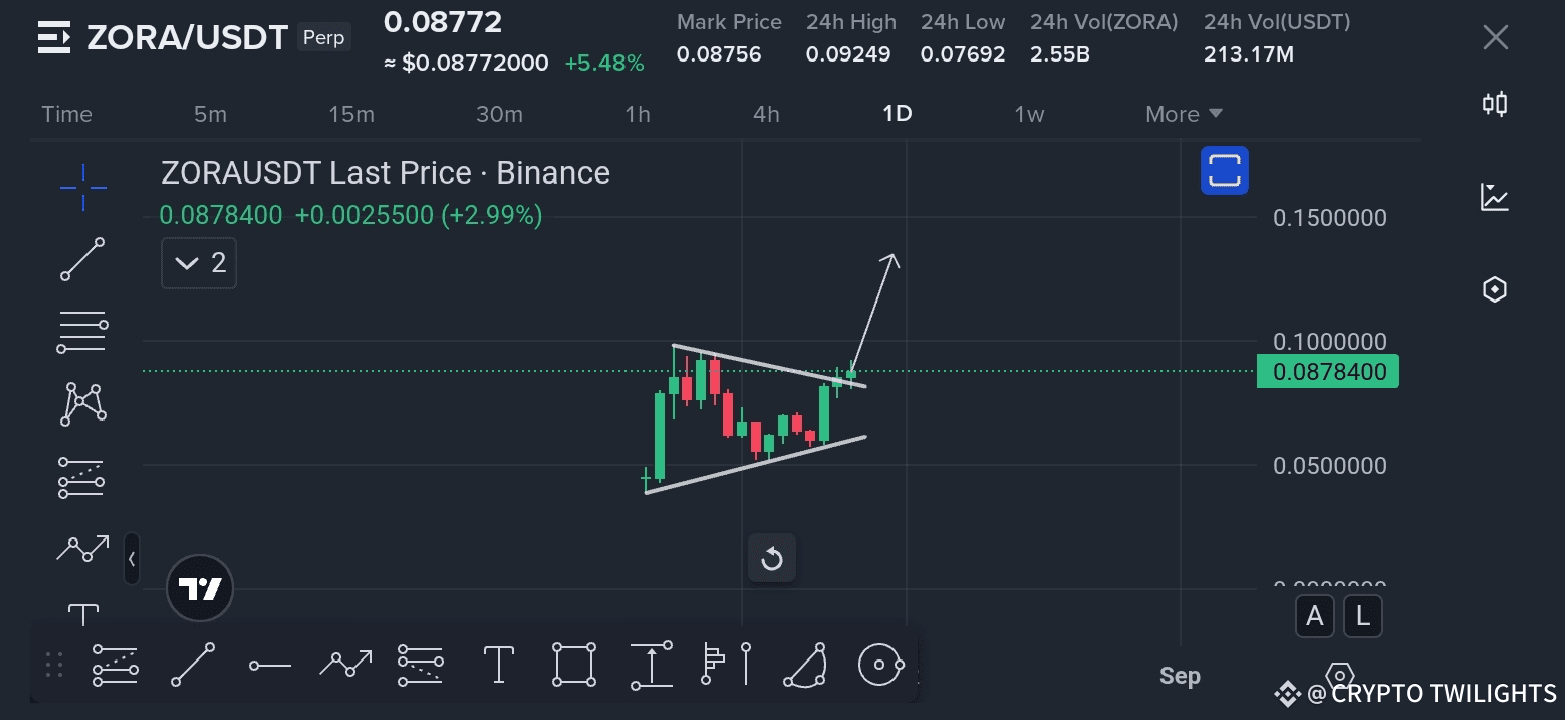
A few days ago, I shared a detailed analysis of ZORA/USDT, highlighting a clear bullish breakout pattern forming on the chart. The setup was textbook — a symmetrical triangle consolidating after a strong upward move. Patterns like these often act as a springboard for price action, and based on my analysis, I indicated that a strong pump was highly likely once the breakout occurred.
In the first chart, you can see exactly where I marked my prediction. Price was trading around $0.087 at the time, with momentum building up and candlesticks getting tighter within the triangle. This kind of price action usually signals that big players are quietly accumulating before making their move.
My projection was clear: once the breakout happened, ZORA/USDT could shoot upward rapidly, with the potential to hit significant percentage gains in a short time. I emphasized that patience was key — the setup was strong, but timing the breakout required holding confidence in the analysis.
Fast forward to today, and the results speak for themselves!
---
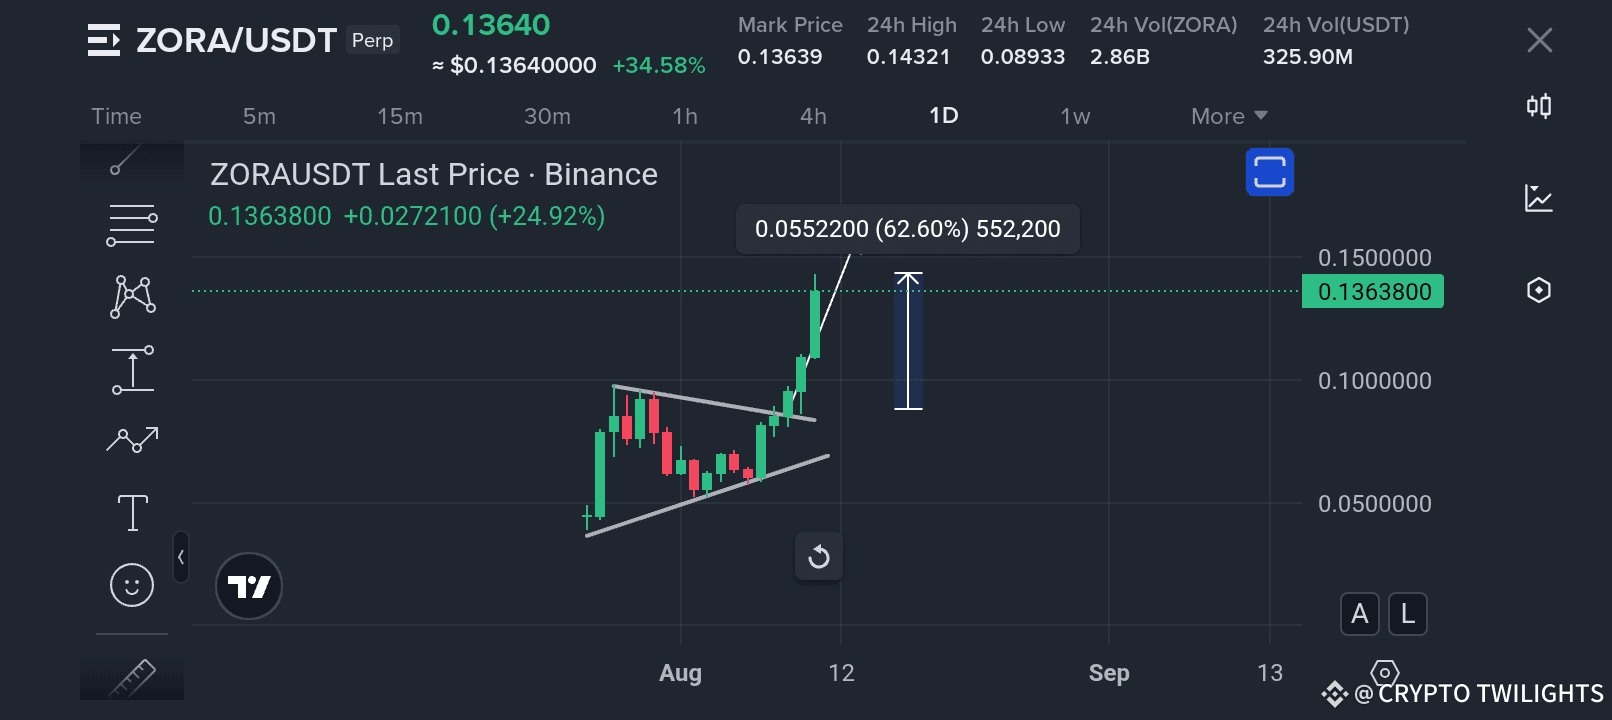
💥 Second Chart – The Pump in Full Swing
From $0.087 to $0.136, ZORA/USDT delivered an incredible +62.6% pump after the breakout. This wasn’t just a random spike; it was a perfect follow-through of the technical pattern we discussed. Traders who entered early based on the breakout confirmation enjoyed huge profits within days.
Here’s the breakdown of what happened:
1️⃣ The Breakout Confirmation – Price broke through the upper resistance trendline with strong volume. This was the signal that bulls had taken full control.
2️⃣ Momentum Surge – Once the breakout level held, more buyers jumped in, pushing price sharply upward.
3️⃣ Target Achievement – The projected move based on the triangle’s height was hit faster than expected, showing strong demand and bullish sentiment in the market.
---
📊 Key Takeaways for Traders
Pattern Recognition Works – The symmetrical triangle pattern is one of the most reliable continuation signals when traded with confirmation.
Volume Matters – A breakout without volume can lead to fake-outs, but in this case, high trading volume confirmed the move.
Patience Pays Off – Many traders exit too early during consolidation phases, but holding through the setup often yields the best results.
Follow the Plan – Having clear entry and target levels before a breakout helps you avoid emotional decision-making during the move.
---
💡 Lessons for the Future
This ZORA/USDT move is a reminder of why technical analysis remains such a powerful tool. By combining chart patterns, trendlines, and volume analysis, we can spot high-probability setups long before they happen.
The market often rewards those who prepare and stay disciplined. Many who saw the first chart might have hesitated, but the results show that when the technicals align, the market tends to respect those signals.
---
🔥 Final Thoughts
This wasn’t just a lucky guess — it was a calculated prediction backed by proven technical patterns. The move from $0.087 to $0.136 is a +62.6% gain, and it’s a great example of how the right analysis can lead to substantial profits.
Congratulations to everyone who trusted the setup and made gains on this move! Stay tuned — more opportunities like this are always around the corner for those who are watching the charts closely.
✅ Prediction Made – Prediction Delivered
ZORA/USDT’s breakout and pump prove once again: when preparation meets opportunity, success follows.
---