---$ZORA
📈 ZORA/USDT Technical Analysis – Symmetrical Triangle Breakout in Play
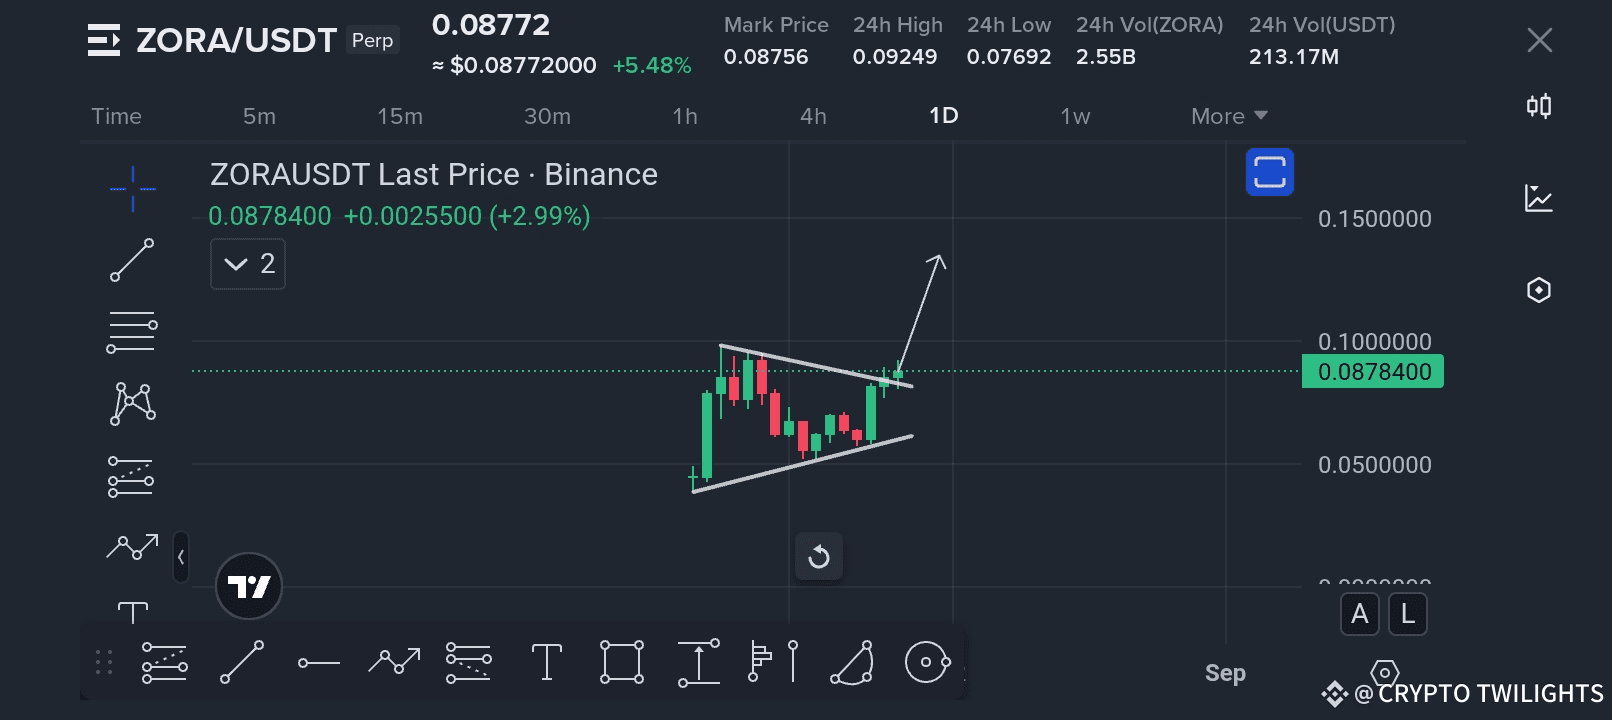
Today, we’re looking at ZORA/USDT on the daily timeframe, and the price action is showing something very interesting – a symmetrical triangle breakout pattern forming, which could potentially set the stage for the next bullish leg. Let’s break down the current situation, possible price targets, and what traders should watch out for.
---
1️⃣ Understanding the Pattern
A symmetrical triangle occurs when the market is consolidating and volatility is tightening. This pattern forms when both higher lows and lower highs converge towards a point, creating a triangle-like shape on the chart. It generally signals that a big move is coming – the only question is: which direction?
In ZORA’s case, the triangle has been forming for several days, with the market respecting both the ascending support line and descending resistance line. Now, price is testing the upper boundary, and the recent breakout above it is a positive signal for bulls.
---
2️⃣ Current Price Action
Current Price: $0.08784
24h Change: +2.99%
24h High: $0.09249
24h Low: $0.07692
Volume: Strong activity with over 2.55B ZORA traded in the last 24 hours, suggesting increasing market participation.
We can see that after multiple rejections at the resistance line, buyers have finally pushed the price above the trendline. If this breakout holds and is confirmed with a daily candle close above the resistance, it could trigger a fresh wave of buying.
---
3️⃣ Bullish Scenario
If the breakout sustains, the next major psychological level will be around $0.10 – not only because of round-number resistance but also because it aligns with a prior swing high. Beyond that, the measured move target for this pattern (based on the height of the triangle) comes in near $0.115 – $0.120.
The momentum seems to be shifting towards the bulls as:
Price is staying above the 20-day moving average.
RSI is gradually climbing without being in overbought territory.
Volume spikes are coinciding with bullish candles, showing buyer dominance.
---
4️⃣ Bearish Risk & Support Levels
No trade is without risk. If the breakout fails and price falls back into the triangle, we could see a false breakout scenario. In that case, the nearest supports to watch are:
$0.083 – $0.084 zone (recent swing low support)
$0.078 – $0.079 (triangle lower boundary)
If these levels break, price could revisit the $0.070 area.
For traders, it’s crucial to wait for confirmation before going all-in. A breakout without follow-through can quickly trap late buyers.
---
5️⃣ Trading Plan Idea (For Educational Purposes Only)
📌 Entry Zones:
Aggressive traders may enter on the breakout above $0.088 – $0.089 with strong volume.
Conservative traders may wait for a retest of the breakout zone as support before entering.
📌 Targets:
Target 1: $0.095
Target 2: $0.100 – $0.102
Target 3: $0.115 – $0.120 (Pattern projection)
📌 Stop Loss:
Below $0.083 (for aggressive entries) or below $0.078 (for conservative entries).
---
6️⃣ Market Sentiment
The overall crypto market sentiment is slightly bullish right now, with Bitcoin holding steady and altcoins seeing some fresh inflows. ZORA has been gaining traction recently, and this kind of consolidation before a breakout often indicates accumulation by stronger hands. If Bitcoin remains stable or bullish, ZORA could have enough momentum to follow through on this breakout.
---
7️⃣ Final Thoughts
The symmetrical triangle breakout on ZORA/USDT is a strong technical signal, but as always, confirmation and proper risk management are key. A successful breakout could lead to a rally towards $0.10 and beyond, while a failed breakout might pull price back into the consolidation range.
Traders should monitor:
Daily candle close above resistance for confirmation.
Volume spikes to validate the breakout strength.
Bitcoin’s price action, as it often influences altcoin moves.
This is not financial advice – always do your own research and trade responsibly. The crypto market moves fast, and volatility works both ways. Manage your positions wisely, and never risk more than you can afford to lose.
---
📊 Summary Table:
Parameter Value
Pattern Symmetrical Triangle
Current Price $0.08784
Breakout Level $0.088 – $0.089
Target 1 $0.095
Target 2 $0.100 – $0.102
Target 3 $0.115 – $0.120
Support Levels $0.083 / $0.078
Risk Factor False Breakout Possibility
---
If you like detailed analysis like this, keep following for more real-time updates on chart patterns, breakout alerts, and technical breakdowns. 🚀📈
---