In the world of cryptocurrencies, prices never move randomly.
Every movement is a trace of the struggle between bulls 🐂 and bears 🐻.
This struggle leaves hints in the form of graphic patterns.
📌 If you decipher them, you will be able to:
Read the market like a book
Predict price movement
Enter a trade before the crowd
---
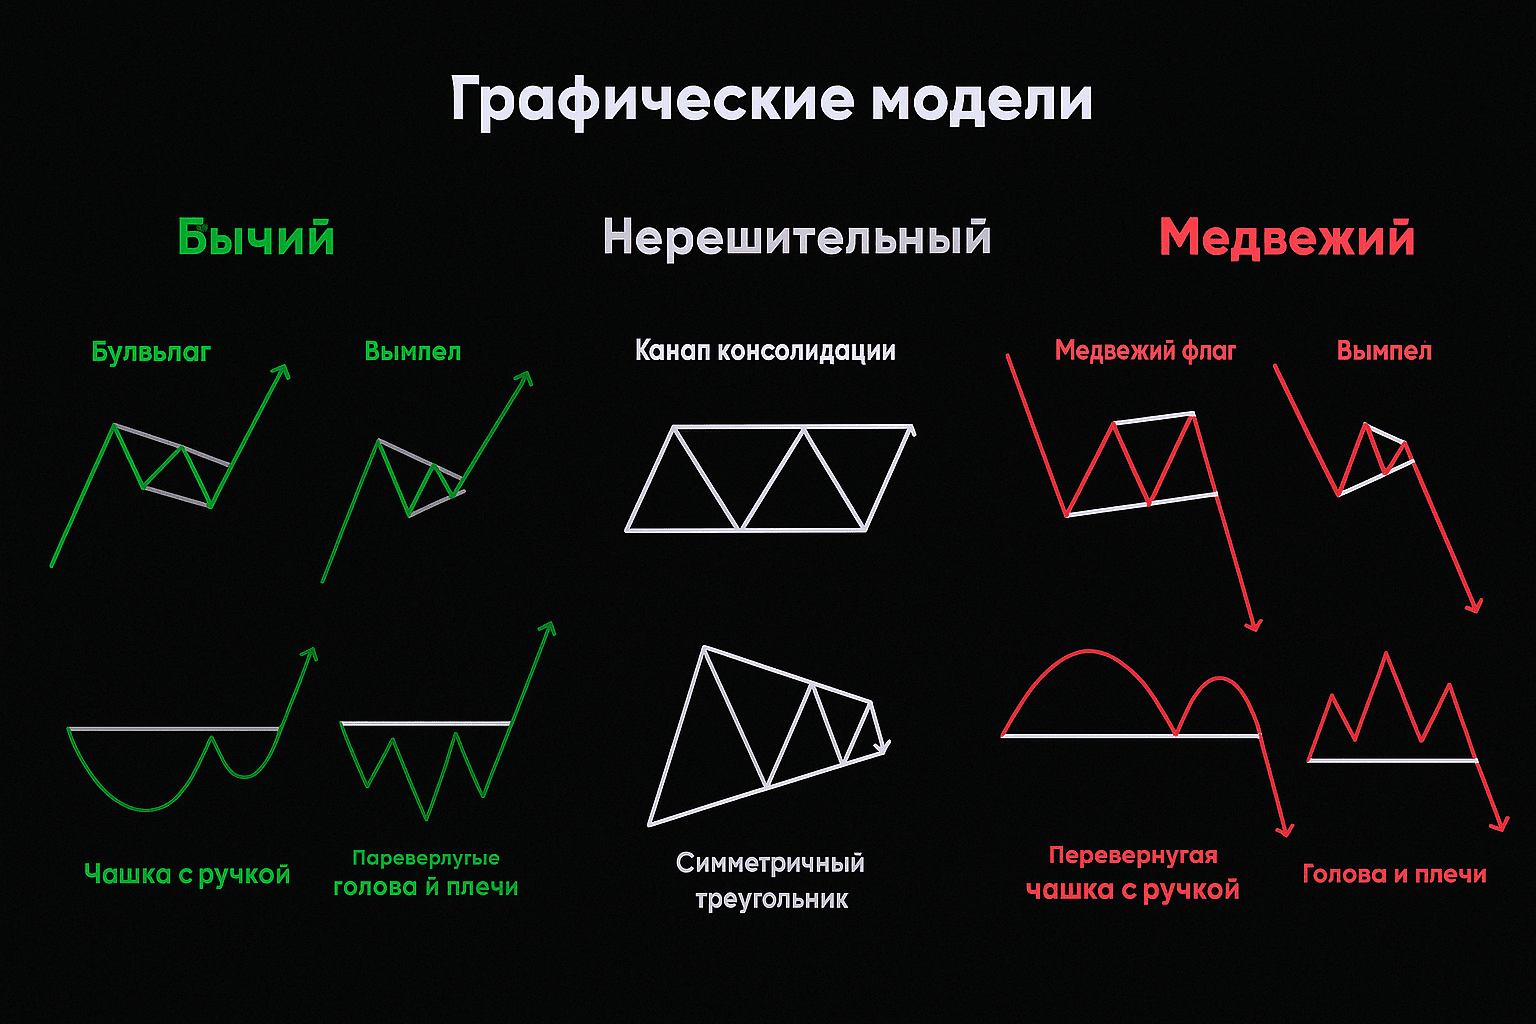
🟢 Bullish patterns — signal for growth
1. Bullish flag — sharp rise → short downward channel → breakout upward.
2. Flag (bullish) — after a rise, the price compresses into a small triangle → breakout upward.
3. Cup and handle — smooth bottom → slight pullback → breakout of resistance.
4. Inverted head and shoulders — three troughs (the middle one is deeper) → breakout of the neckline.
---
⚪ Indecisive patterns — the market is waiting
5. Consolidation channel — movement sideways between parallel lines.
6. Symmetrical triangle — price compresses, trend lines converge → breakout in either direction.
---
🔴 Bearish patterns — signal for a drop
7. Bearish flag — sharp drop → ascending channel → breakout downward.
8. Flag (bearish) — triangle after a drop → breakout downward.
9. Inverted cup and handle — smooth peak → slight pullback upward → drop.
Head and shoulders — three peaks (the middle one is higher) → breakout of the neckline downward.
---
💡 Tip:
Patterns are not magic, but a map of market psychology.
Always wait for confirmation of a breakout before entering.
Even an ideal setup can fail in a volatile market.