
USDT Transaction Analysis on TRON Network (TRC-20):
1. Introduction
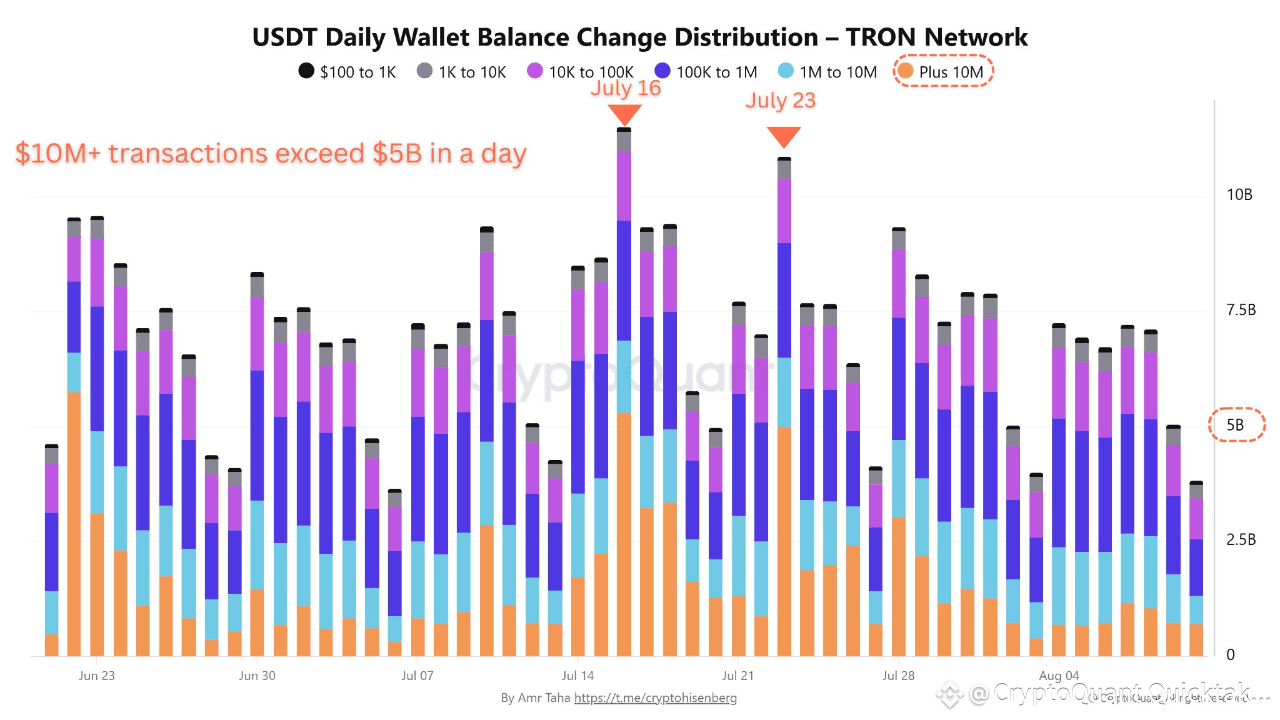
* This chart provides a daily breakdown of USDT (TRC-20) transfers on the TRON blockchain, categorizing transactions by size and tracking wallet balance changes.
* The analysis focuses exclusively on TRC-20 USDT transactions, filtering out noise from other networks.
How the Analysis Works:
Step 1: Calculating Daily Wallet Balance Changes
Step 2: Segmenting Transactions by Size
Each transaction is classified into one of six buckets:
Retail $100 – $1K Small traders
Mid-Tier $1K – $10K Active traders
High-Volume $10K – $100K Businesses, OTC desks
Whale Lite $100K – $1M Institutions, funds
Mega Whales $1M – $10M Hedge funds, exchanges
Super Whales $10M+ Institutional moves, market makers
Step 3: Detecting Market Signals:
When $10M+ transactions exceed $5B in a day, it often signals large-scale profit-taking in Bitcoin.
Why?
* These transfers typically represent BTC sell-offs → USDT conversions.
* The USDT is then moved to private wallets (away from exchanges).
* This reduces BTC buy pressure, often leading to corrections.
Real-World Examples:
📉 July 16: Over $5.2B in $10M+ USDT transfers → BTC dropped 4.5% shortly after.
📉 July 23: Another $5.8B spike → BTC fell 3.8% within 48 hours.
Conclusion: Why This Matters:
Large USDT movements can serve as an early warning for BTC corrections.
Recent data indicates that the lack of $10M+ transactions suggests whales are not cashing out into USDT.
Written by Amr Taha

