
Bitcoin is back in the spotlight as the price recovers to $118,236 after dipping slightly to $112,600 earlier this week. This recovery, bolstered by moving past a long-term downtrend line, has rekindled optimistic sentiment. Traders are now asking the big question: can BTC finally break above the $120,000 mark and set the stage for a new bull run?
Bitcoin Chart Analysis: What's Happening with BTC Coin?
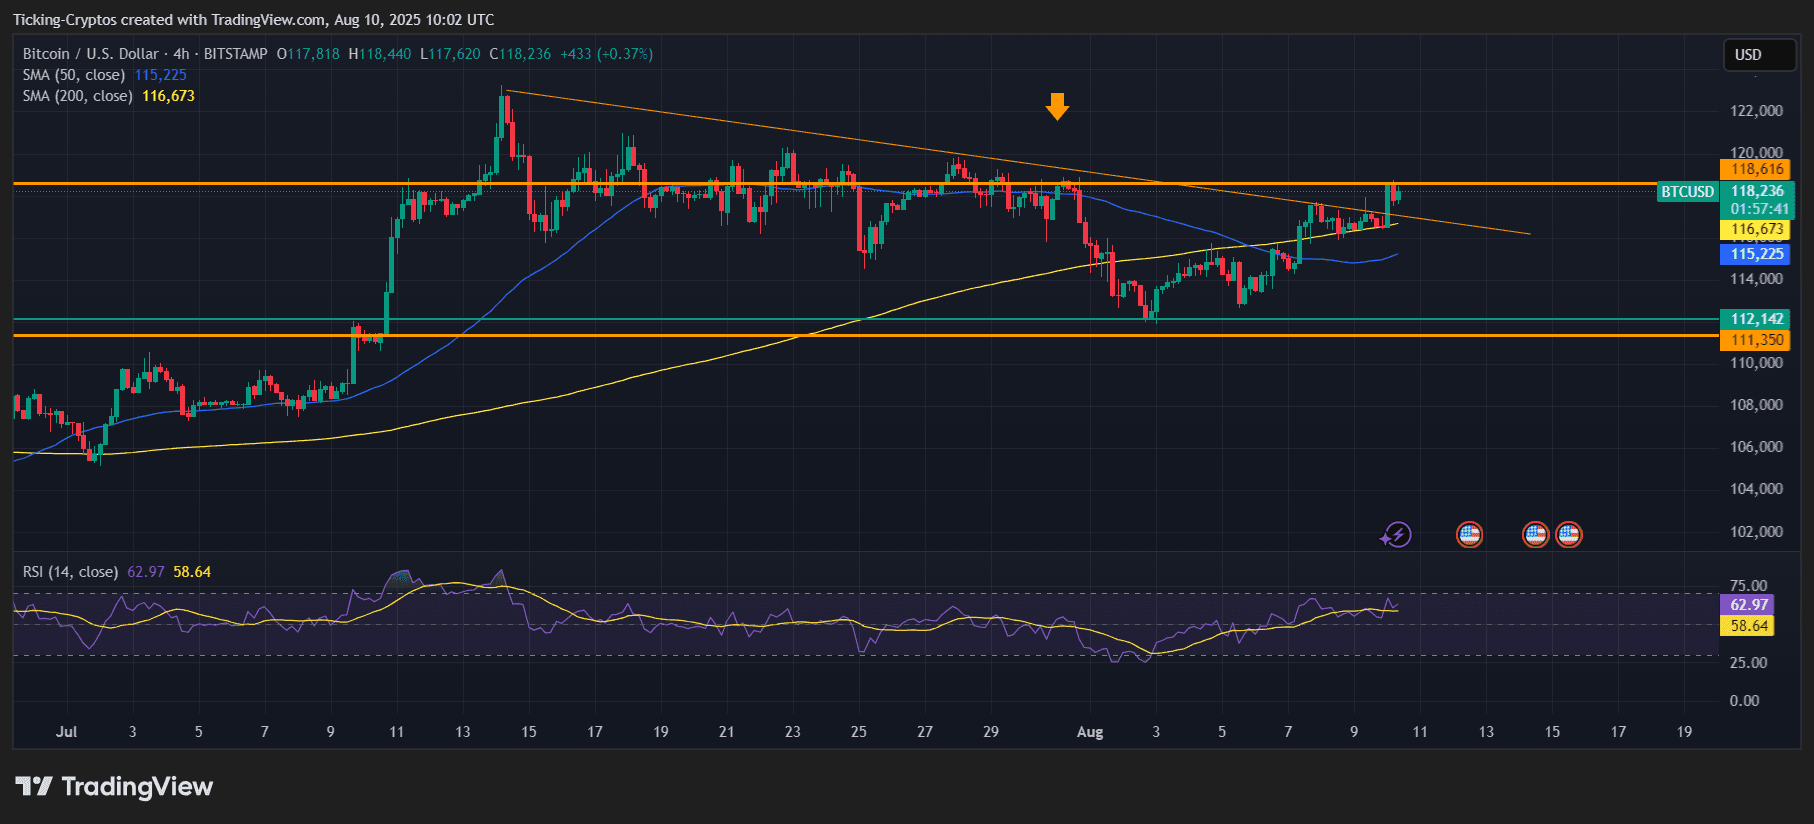
The 4-hour BTC/USD chart shows a clear breakout from the descending resistance line that has constrained prices since mid-July. This breakout coincides with the price surpassing both the 50-day SMA at $115,225 and the 200-day SMA at $116,673 — a bullish technical signal indicating that the upward momentum is shifting in a positive direction.
The RSI indicator is currently at 62.97, indicating that BTC has room to rise further before entering the overbought zone. However, the $118,616 level remains a strong resistance; a daily close above this area could open the door towards $120,000 and beyond.
Key Support and Resistance Levels
Immediate resistance level: $118,616
Key resistance level: $120,000
Immediate support: $116,673 (200 SMA)
Key support: $112,142 – $111,350
If Bitcoin cannot hold above $116,673, the price may drop to $112,000, where strong buying demand could re-emerge.
Bitcoin Price Prediction: Market Outlook and Future BTC Prices
Breaking through the resistance level on the trendline is a strong technical development. As long as BTC maintains support above $116,000, the path of least resistance will still be upward. A confirmed close above $120,000 could set the stage for a rise to $123,500 and potentially $130,000 in the coming weeks.
Considerations for Trading Strategy: How to Trade BTC Today
Traders may look for buying opportunities when the price retests the breakout level ($116,700–$117,000) with a target near $120,000 and $123,500. Risk management remains a key factor, as rejection at $120,000 could trigger a pullback to lower support levels.
Bitcoin's recent recovery has allowed buyers to regain control, but the battle around the $120,000 mark will determine whether this is the start of a major bull run or just another short-term rally. Currently, technical indicators are supporting a continuation of the bullish trend.