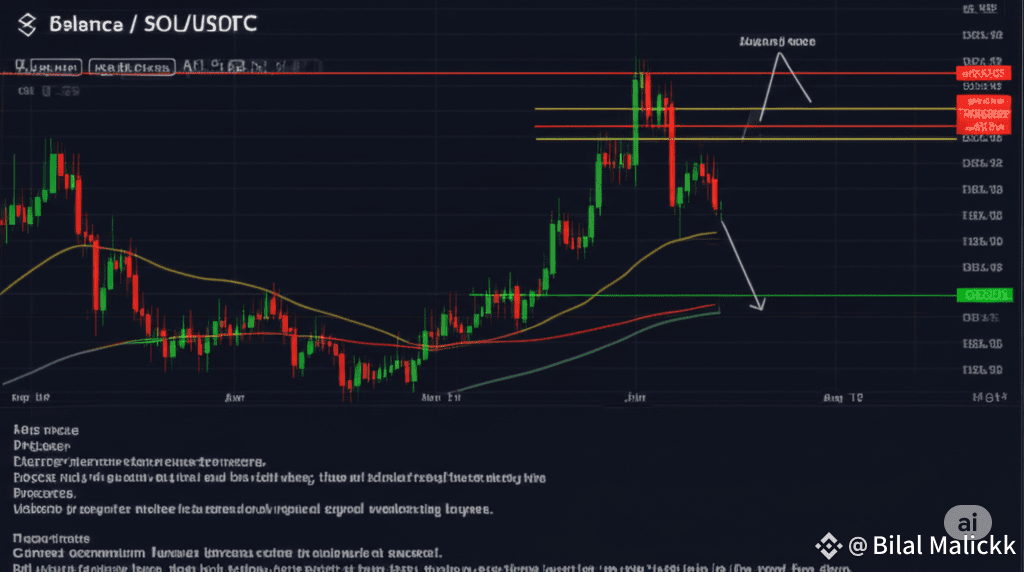
As Solana ($SOL ) continues its impressive run, traders and investors are eyeing key levels to determine its next major move. The recent price action has created two distinct scenarios, one bullish and one bearish, that could shape the short-term future of the SOL/USDT pair. Let's break down the technical triggers and targets for each.
📈 Bullish Scenario: The Push to New Highs
A decisive break and close above $200 USDT with strong buying volume would be the primary trigger for a bullish continuation. This move would confirm that bulls are firmly in control and have absorbed any selling pressure at this psychological resistance level.
The technical indicators currently support this optimistic outlook:
Moving Averages: The 7-period Exponential Moving Average (EMA) is above the 25-period EMA, which is in turn above the 99-period EMA. This is a classic bullish alignment, suggesting a strong and established uptrend.
MACD: The Moving Average Convergence Divergence (MACD) is positive and rising, indicating that upward momentum is accelerating.
Price Structure: The chart shows a clear pattern of higher lows, which is a classic sign of trend continuation.
If this scenario plays out, we could see SOL target the following levels:
Target 1: The recent swing high of $206.30.
Target 2: The next supply zone, spanning from $209 to $215.
Target 3: If momentum remains exceptionally strong, a push toward $225 and beyond is possible.
📉 Bearish Scenario: A Potential Pullback
Conversely, the bullish momentum could stall. A clear rejection at the $200–$206 resistance zone, followed by a drop below $183.50, would activate the bearish scenario. This suggests that profit-taking is overwhelming the buying pressure and a short-term correction is likely.
The reasoning behind this scenario is straightforward:
Resistance Failure: A failure to break a key resistance level often leads to a wave of profit-taking from those who bought at lower prices.
Volume: A drop in buying volume accompanied by red candles would signal that buyers are losing their conviction.
In this case, the following targets would come into play:
Target 1: The 25-period EMA support at $176.50.
Target 2: A previous demand zone around $170.65.
Target 3: In a more significant pullback, SOL could test a key support level around $157.80.
Key Takeaways
The current price action heavily favors the bullish scenario, as $SOL is trading above all its key EMAs with rising volume. The critical level to watch is $183.50; as long as the price stays above it, the bulls are in control.
While not visible on the provided chart, traders should keep a close eye on the Relative Strength Index (RSI). Given the recent price surge, the RSI may be approaching overbought levels, which could signal a temporary pause or pullback even in a strong uptrend.
Which scenario do you think is more likely to unfold for Solana in the coming days?$SOL