🚀 SOL/USDT — Is the Next Breakout Brewing? 🚀
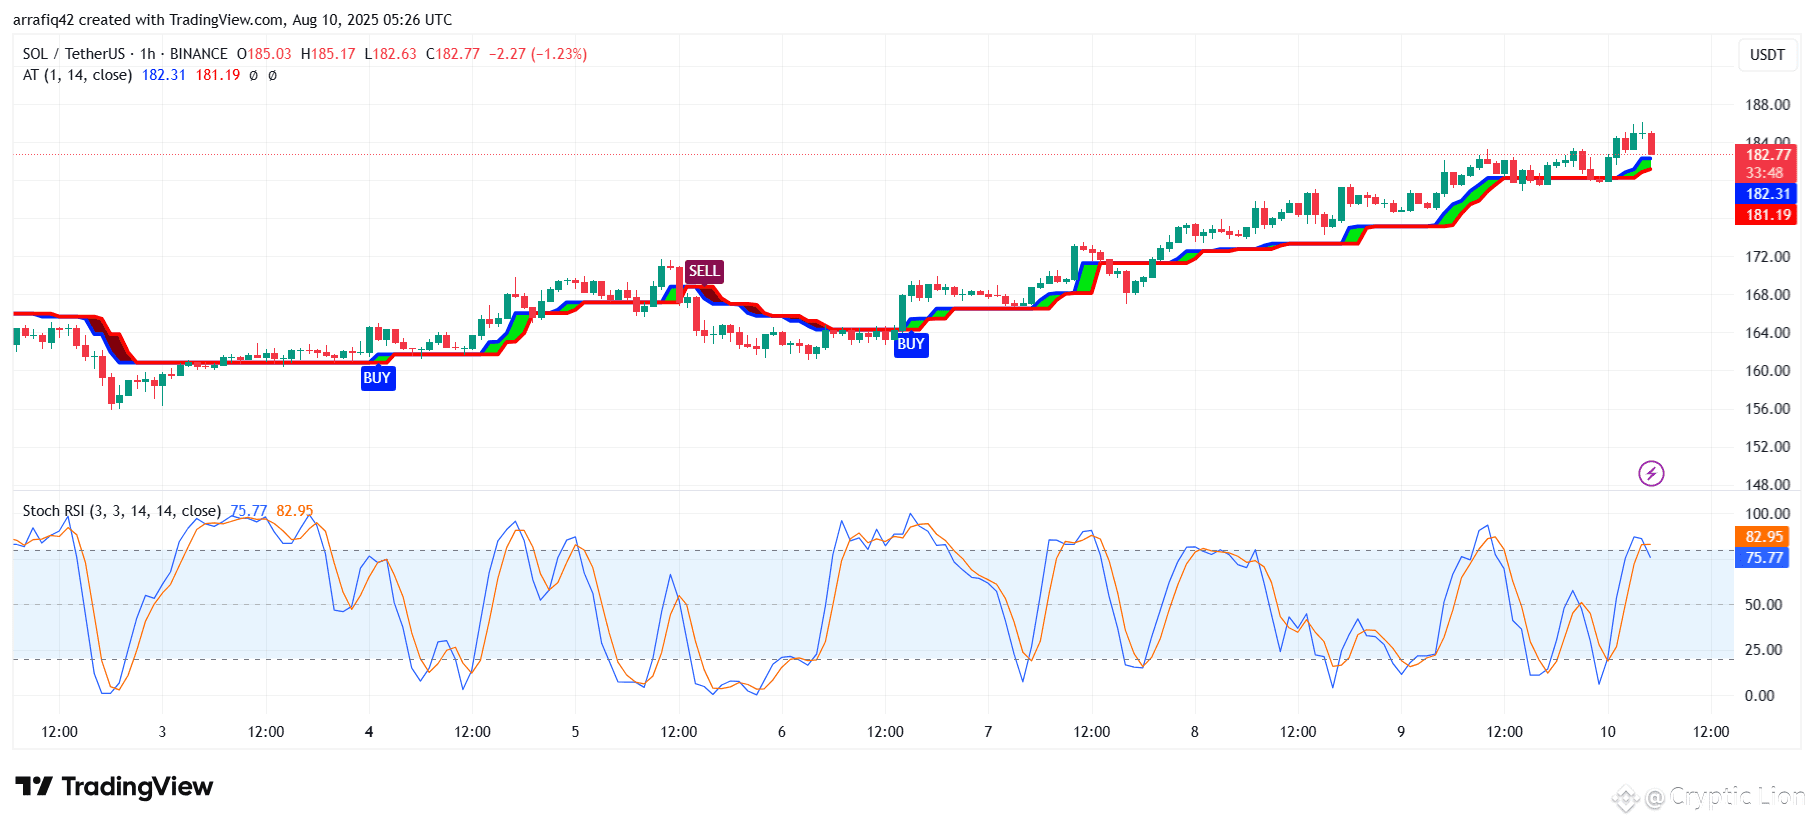
Solana has been on a steady climb after the recent BUY signal, pushing above the $180 mark and showing strong bullish structure on the 1H chart. The Alpha Trend indicator still flashes green, and the Stochastic RSI is heating up near the overbought zone — a classic sign that momentum is alive. 📈
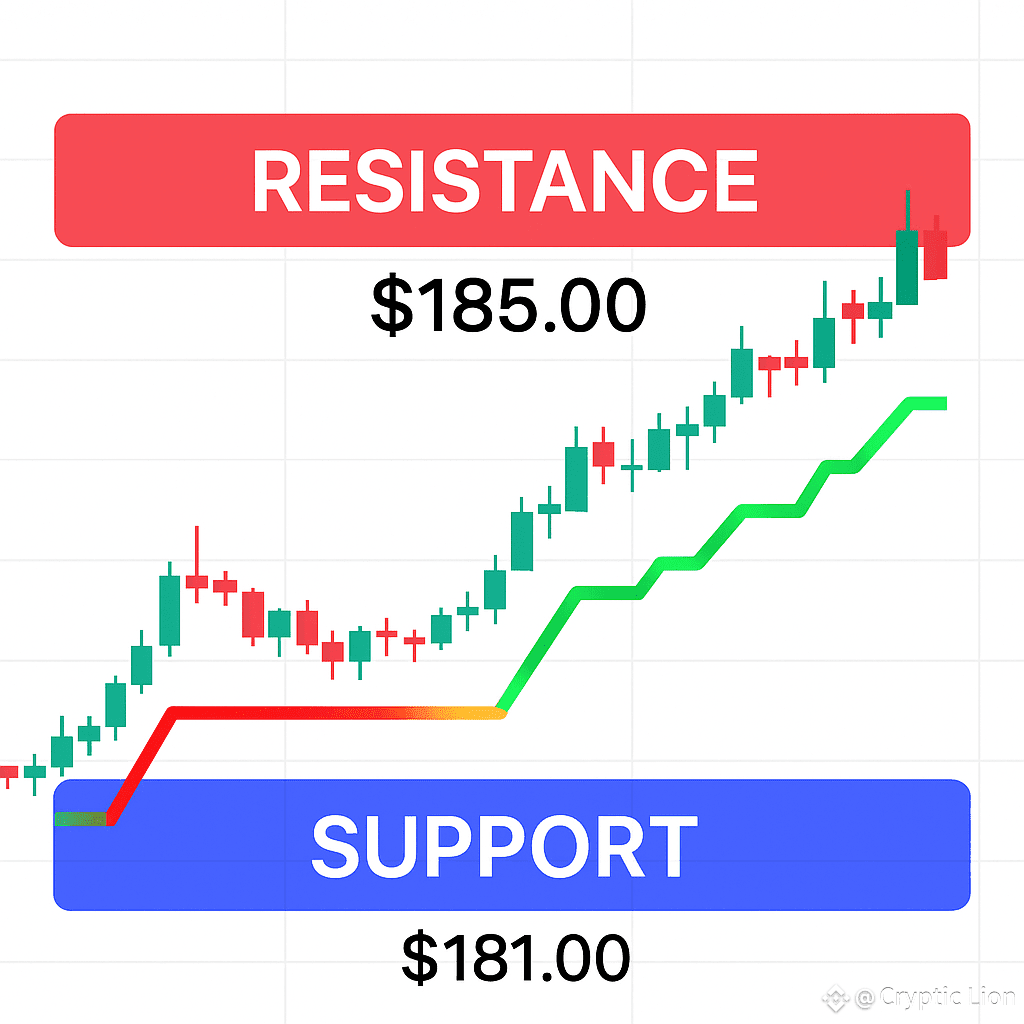
💡 Key Zones to Watch:
Resistance: $185.00 — Break and hold above this could open the gates to $190+.
Support: $181.00 — A strong bounce here could fuel the next wave.
📊 Bulls are eyeing the breakout, while bears are waiting for exhaustion.
💬 What’s your play — ride the breakout or fade the rally?