
1. Technical Outlook
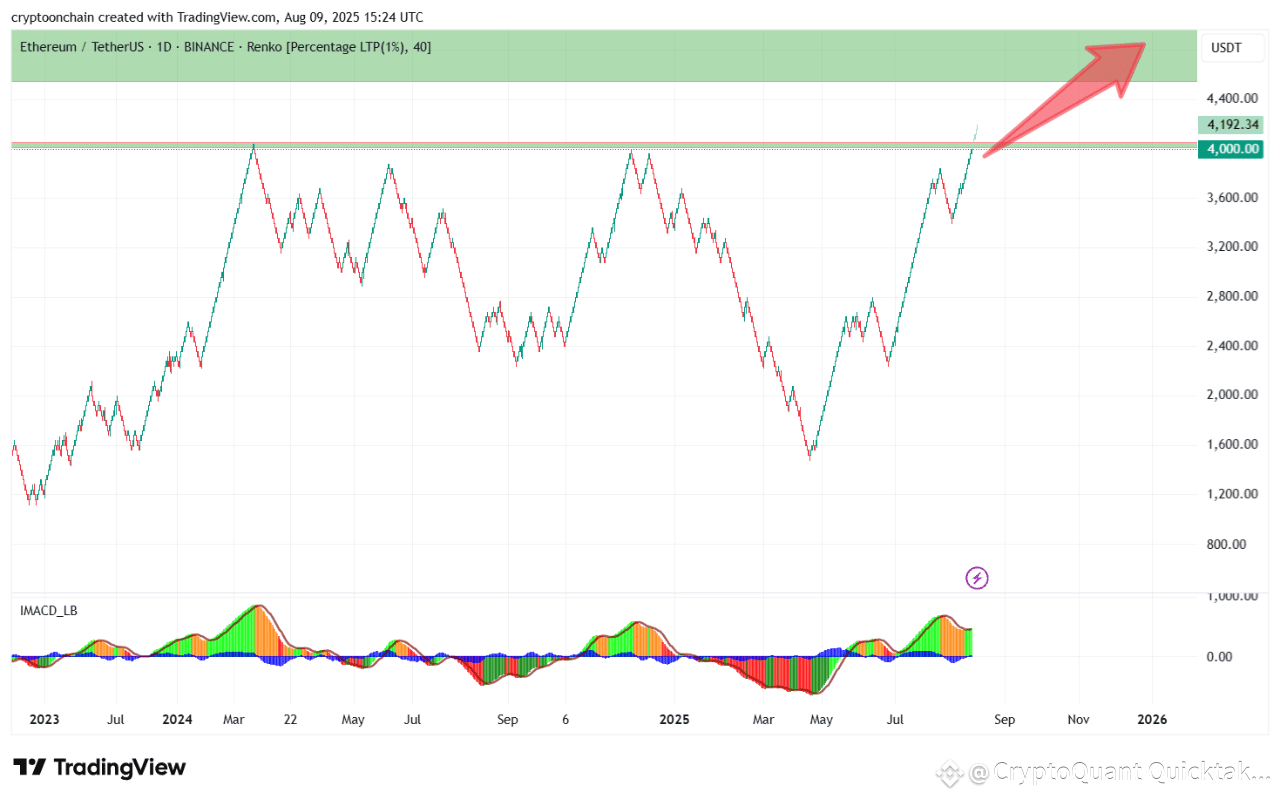
On the Renko chart (Renko 1% LTP), Ethereum has surged from the 2,400areatoaround2,400 area to around 2,400areatoaround4,190 and is now attempting a breakout above the key $4,000 psychological and technical resistance.
The green zone between 4,000and4,000 and 4,000and4,400 marks a multi-year resistance range with strong historical selling pressure.
MACD histogram has flipped positive and is expanding, signaling strong bullish momentum.
A confirmed breakout and daily/weekly close above 4,400couldopenthedoortowardretestingtheall−timehighregion(4,400 could open the door toward retesting the all-time high region (4,400couldopenthedoortowardretestingtheall−timehighregion(4,800 and beyond).
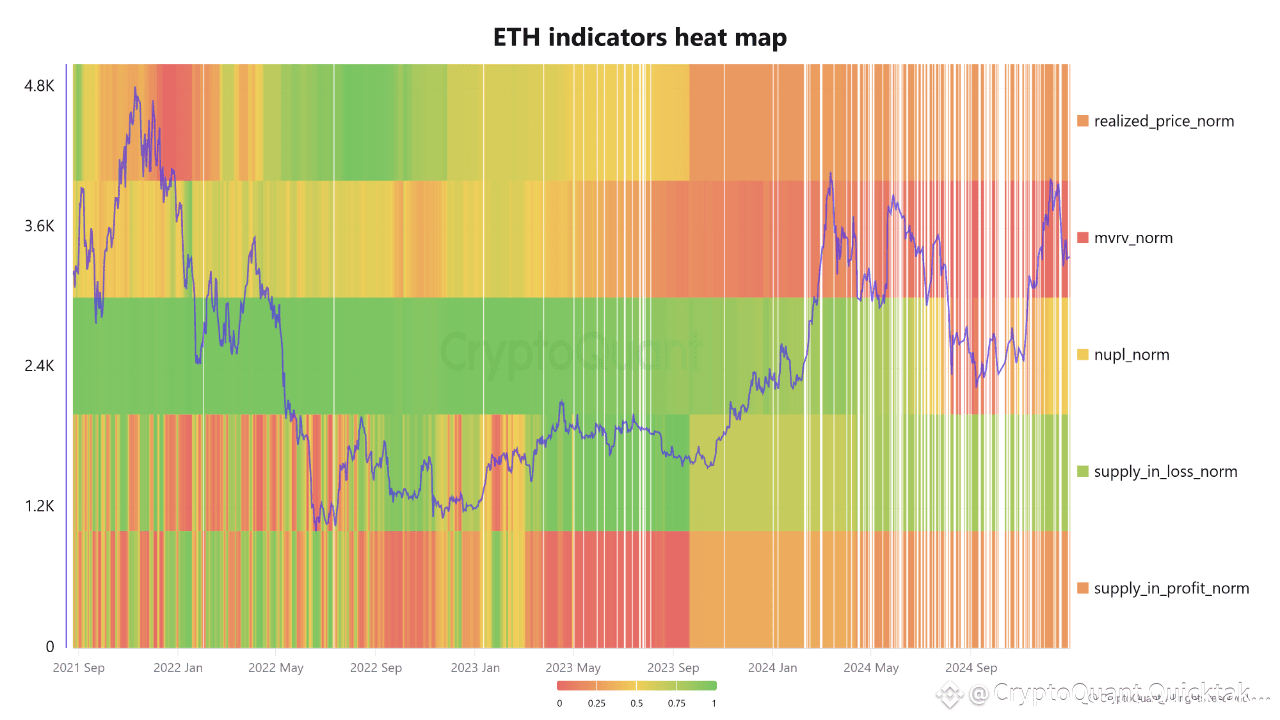
2. On-Chain Data (Heatmap)
From the normalized Heatmap:
• mvrv_norm (deep red) is near upper historical ranges → a large portion of holders are in profit; historically this can trigger selling pressure, but it is still within a rally phase.
• supply_in_loss_norm (green) is near historical lows → very few addresses are underwater → sellers are weak.
• realized_price_norm is rising alongside market price → signals fresh capital inflow and higher realized network value.
• nupl_norm is in a high-positive zone → investors are broadly in profit but not yet in full “euphoria” mode.
• supply_in_profit_norm (orange) is elevated → confirms widespread profitability.
3. Summary & Scenarios
• Primary short-term scenario: Break above 4,400withmomentumcouldleadto4,400 with momentum could lead to 4,400withmomentumcouldleadto4,800 in the near term if buying pressure remains strong.
• Medium-term view: On-chain metrics have not yet reached extreme overheated levels (e.g., MVRV > 3, peak NUPL), suggesting room for further upside before major cycle tops.
• Risk note: Profit-taking pressure may increase as more holders move deep into profit, especially if momentum fades after $4,400.
Written by CryptoOnchain
