25/08/09 BTC oscillating upward to 135,000, ETH will challenge 4800, please enjoy the altcoin carnival.
In the trading market, no one is forever a god, only you are your own god, and you are responsible for your own funds.
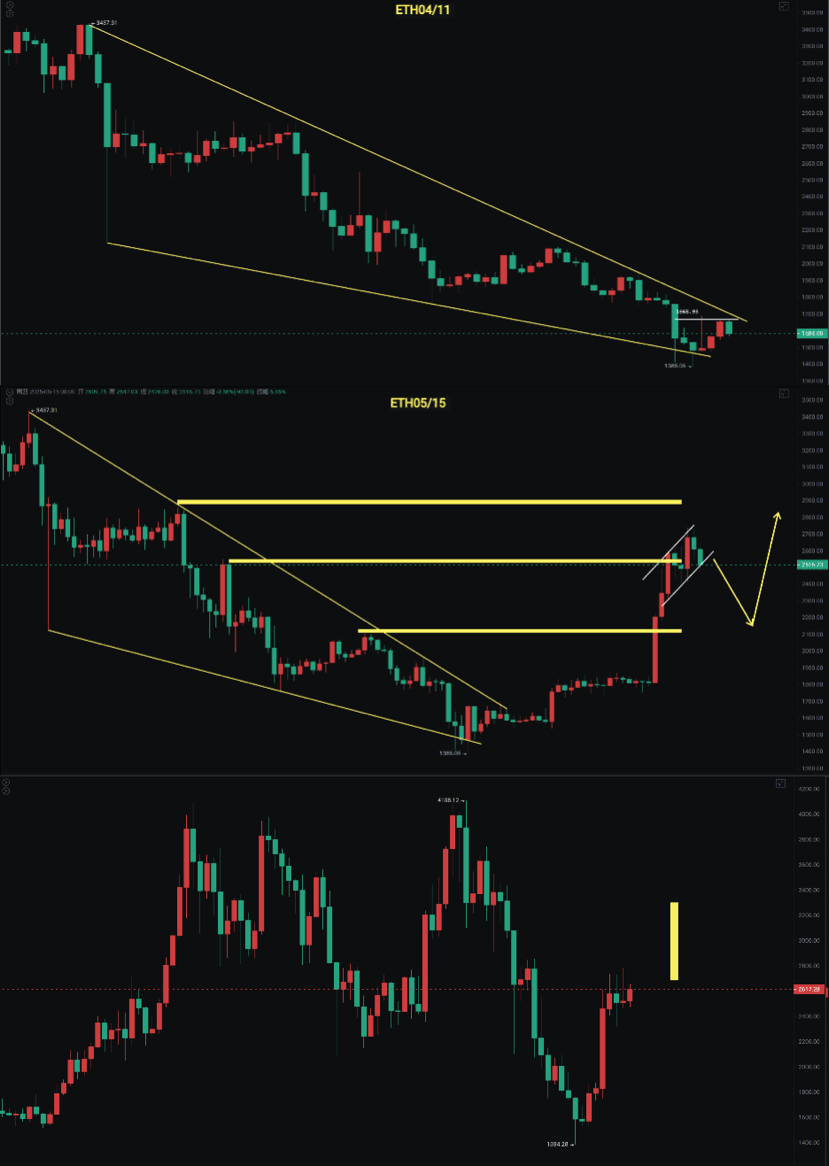
The most exciting news today should be that Ethereum broke through 4100, reaching a high of 4246. This is also the first time since March 24 that it has touched the vicinity of 4100, which has been 517 days since the last breakout. The weekly convergence triangle has broken through, which also means breaking the pressure at 4100. The young master was already wildly bullish on Ethereum back in May and June. After a series of doji stars in early May, he felt it would follow a throw-brick-to-attract-jade pattern, but would first make a correction along with Bitcoin before continuing its upward trend towards 3300 to 3500, and even reaching the target of 4000 has already been accomplished.
The weekly line has not yet closed, but the convergence triangle has already broken. I previously mentioned that if we consider the previous surge to 4868 as the first wave, and the oscillation from the bottom in late 2022 until now as the second wave, then it has now broken through and is moving towards the third wave with a geometric increase pointing towards around 6700 (mid-term target). However, for now, do not FOMO; the next resistance on the weekly line is the last bull market high of 4868. There will definitely be a pullback along the way, which also depends on whether Bitcoin can break through and continue to oscillate upward.
Bitcoin
Bitcoin's daily line retraced to 115800 last night and then continued to rebound. During the day, it reached a high of 117900 before falling back. The movement here is consistent with what I predicted a few days ago, which is that in the short term, it will continue to oscillate upward here. We will see whether it breaks through with a large bullish candle or continues to test the resistance.
The daily line has reclaimed above 115700. Today it is again testing the upward bull flag. The MACD histogram is continuously shrinking, and the fast and slow lines show potential crossover; however, from the perspective of volume, there is no increase in volume or RSI breakout. Therefore, the indicators are rebounding upwards. I previously mentioned that as long as the price does not fall below 115700, we cannot be bearish.
Support: 114700—115700
Resistance: 121000—123000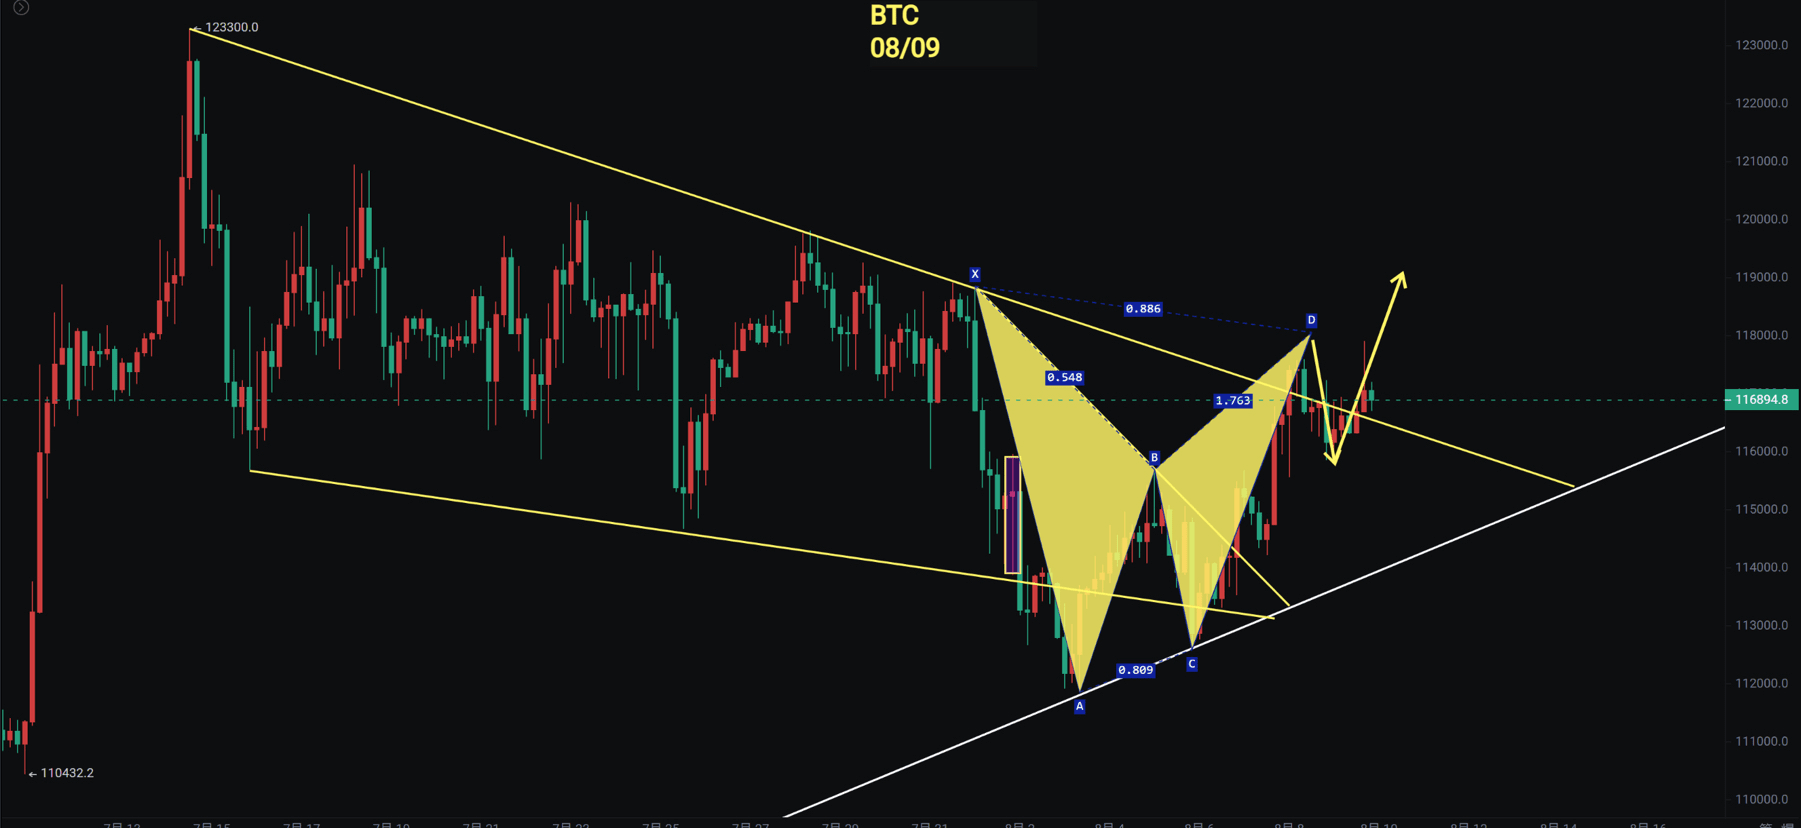
Ethereum
Ethereum has reached a new high in a year and a half. As long as the price stays above 3950, it is considered a true breakout. Previously mentioned was the monthly bottom divergence which presented an opportunity for a breakout. In August, it turned red after only 9 days, and the fast and slow lines of the RSI also broke through. The weekly chart has not yet fully formed, but I will continue to share updates.
The daily line has broken through the previous high point of 4100. The MACD histogram has turned red and the fast and slow lines have crossed. Since I raised this alert on August 3rd, Ethereum's rebound has reached an increase of 24%. The ETH/BTC exchange rate broke through MA60 to reach 0.03587. A few days ago, I mentioned that once it breaks MA60, there is a chance to touch MA120. Here also near Fibonacci 0.382 at 0.436, Ethereum and altcoins will need to pay attention to the magnitude of the correction.
Support: 3950—4100
Resistance: 3500—4800