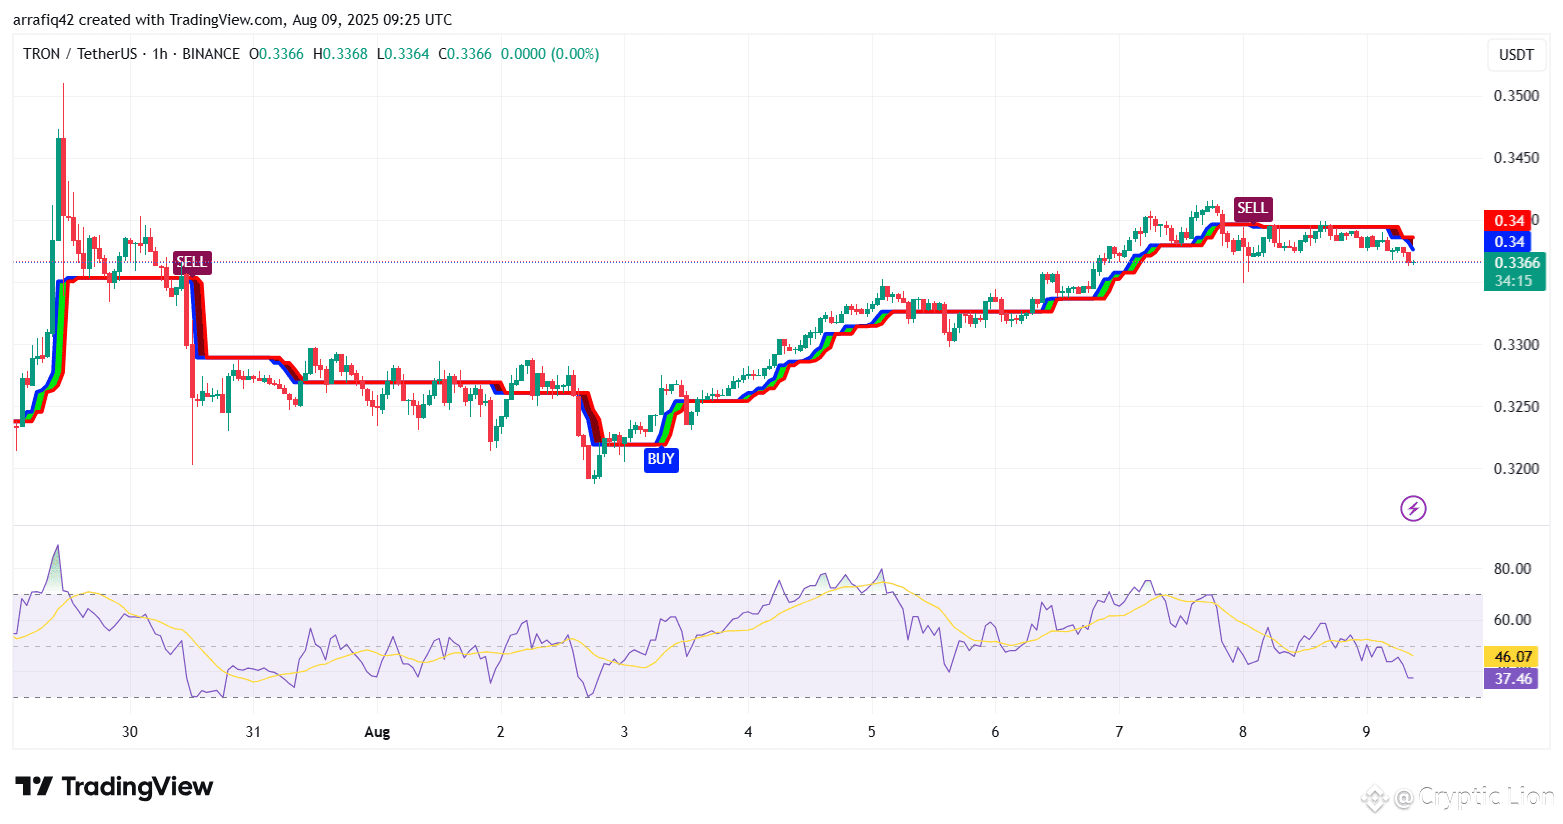
$TRX TRX is currently trading around $0.3366 on the 1-hour chart, following a recent SELL signal from the trading system. The price has slipped below the moving average ribbon, indicating short-term bearish momentum.
The RSI is at 37.46, approaching oversold territory (<30), suggesting that while selling pressure is present, a potential relief bounce could occur if sellers exhaust momentum. However, the RSI’s downward slope confirms that bearish sentiment is still in control for now.
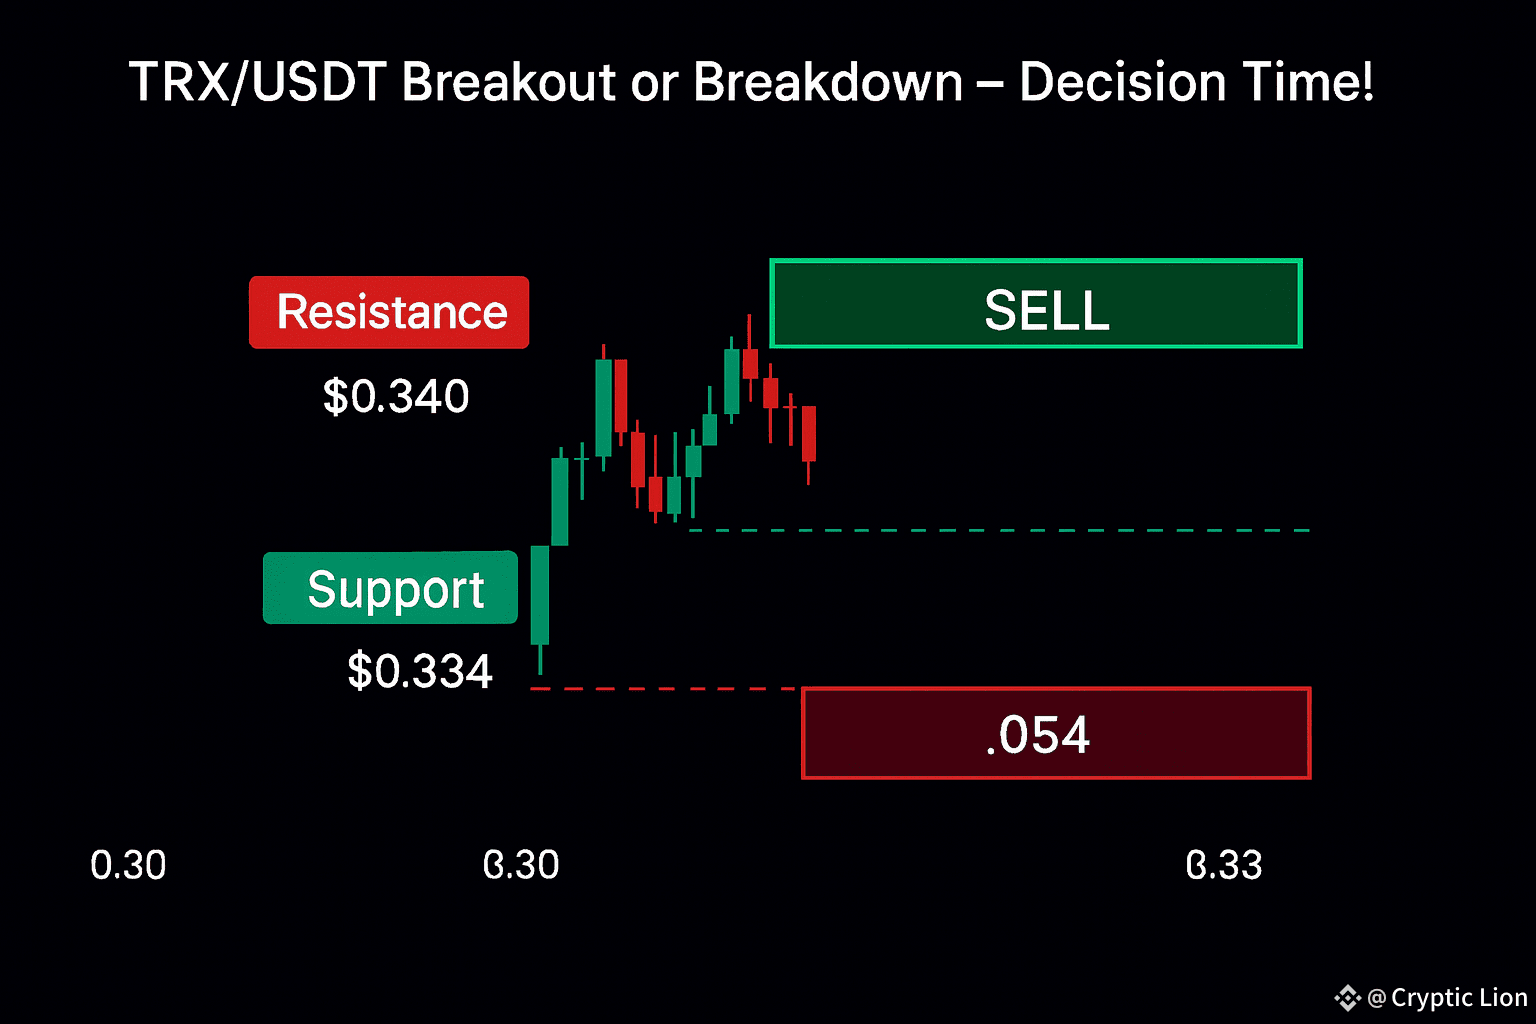
Key support lies near $0.332–$0.330. A breakdown below this area with increased volume could trigger further downside, potentially retesting the $0.325 zone. On the upside, immediate resistance is around $0.340 — a close above this level would be the first sign that buyers are regaining control.
Short-Term View:
Bearish bias until price reclaims the $0.340 resistance.
Watch RSI for signs of reversal or further breakdown.
Strong caution for long positions while the SELL signal remains active.
Sell Zone: Below $0.334 with volume confirmation.
Buy Zone: Only if price reclaims $0.340 with bullish confirmation.
⚠ This is general market information only, not financial advice. Please consult a licensed professional before trading.