XLM Spot Trading Analysis — 1-Hour Chart (Aug 10, 2025)
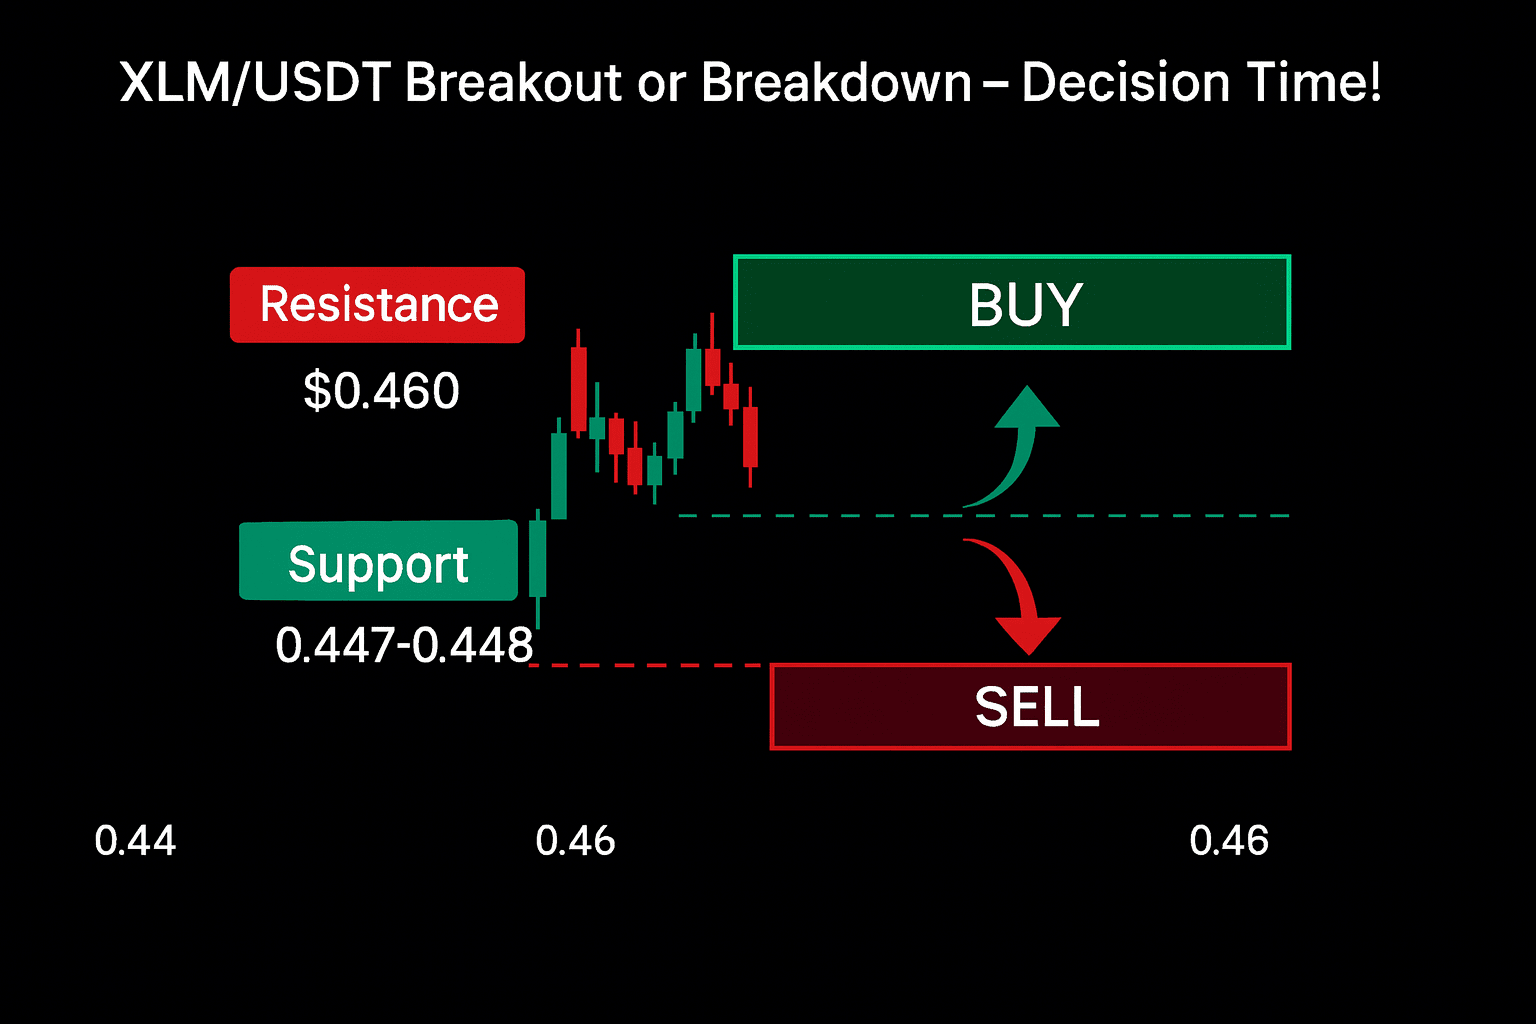
Current Price: ~$0.448
XLM is holding steady above the mid-$0.44 zone, showing buyers are defending short-term support despite repeated pushes into the $0.46 resistance area. The 1-hour chart indicates a consolidating structure, with momentum leaning slightly bullish as long as key support holds.
Key Spot Trading Levels
Immediate Resistance:
$0.460 — First intraday barrier.
$0.465–$0.470 — Strong supply zone from recent peaks.
A clean 1-hour close above this range could open upside toward $0.487, and if momentum continues, $0.505 is the next target.
Immediate Support:
$0.447–$0.448 — Short-term demand zone; buyers are active here.
$0.440–$0.438 — Next support if the first zone fails.
Deeper support rests at $0.432–$0.431.
Spot Trading Strategy (1-Hour)
Buy Zone: Look for spot entries on dips near $0.447–$0.448 with signs of recovery.
Breakout Buy: Enter spot positions on a confirmed 1-hour close above $0.465, aiming for $0.487–$0.505.
Take Profit: Consider partial profit at $0.487 and full exit near $0.505 if momentum fades.
Stop Loss (Spot Protection): If price closes below $0.447, reduce or close positions to protect capital.
Market Outlook
For spot traders, XLM is currently in a neutral-to-bullish setup on the 1-hour timeframe. The bullish case strengthens if price sustains above $0.465, while a breakdown below $0.447 could trigger deeper retracement. Volume confirmation on breakouts will be key for reliable spot trade entries.