8 years! A full 8 years! I was tormented in the crucible of the cryptocurrency circle, burning not just savings, but my soul! My hope! In the first three years, the account was like a dike eaten away by moths, collapsing more than 100! Those sleepless nights, those gritted teeth, those heartbreaking roars in front of the transaction records... have all become brands imprinted on my heart.
In the last four years, the market has become my ATM! Hundreds of coins have been easily earned. Don't ask about luck, this market only recognizes two things: deep cognition and strict discipline!
Before talking about technology, let's talk about a trader. I don't know if you recognize him.
Rayner Teo is an independent trader, formerly a proprietary trader with nearly 15 years of trading experience. Today his own trading blog is quite popular. He mainly follows trends to trade. He believes that in addition to trading skills and strategies, whether traders can abide by principles and have good psychology are very important.
In his view, the most common mistake traders make is that they always expect to find a "trading holy grail", ignoring the learning and experience accumulation in actual trading. Rayner Teo advises trading novices to build a detailed plan. This plan should set some parameters for each transaction, such as which market conditions can be traded, how to enter and exit the market, and how to manage transactions. If trading is always losing money, then be sure to reflect on your trading plan in a timely manner and continuously improve it.

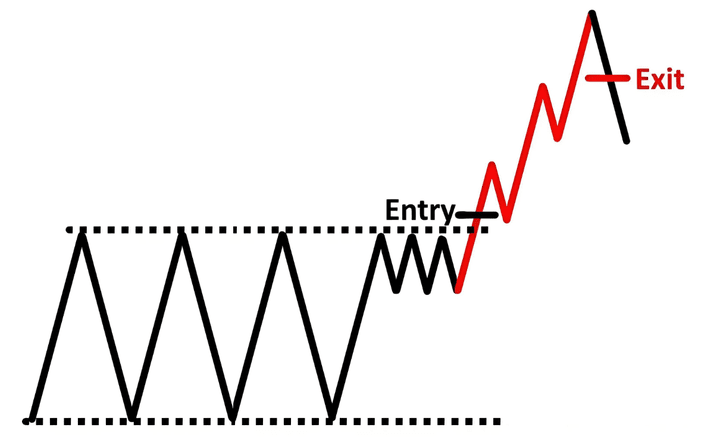
In short, breakout trading aims to capture entry opportunities when the underlying asset breaks through its original pattern or key price levels.
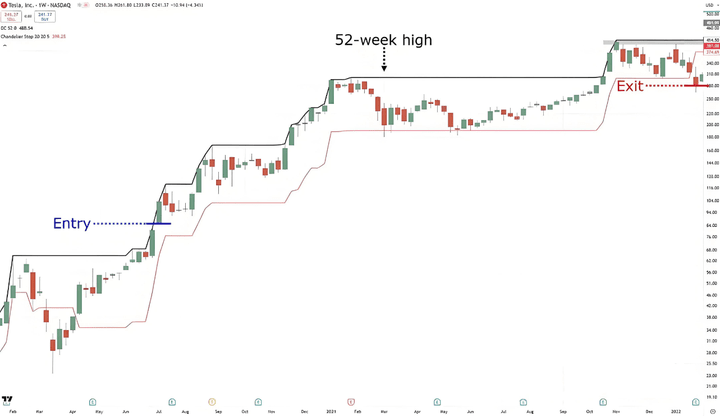
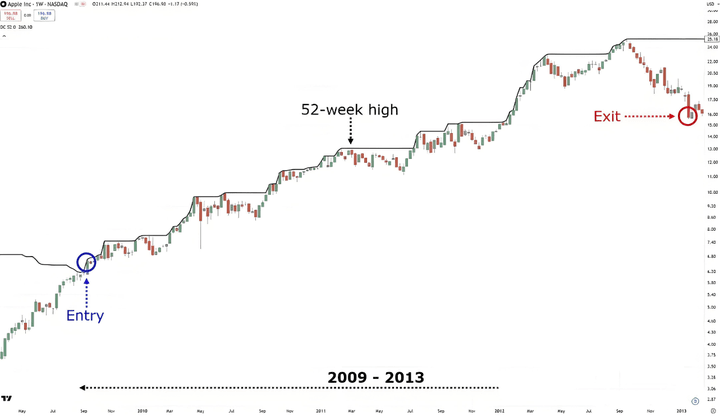
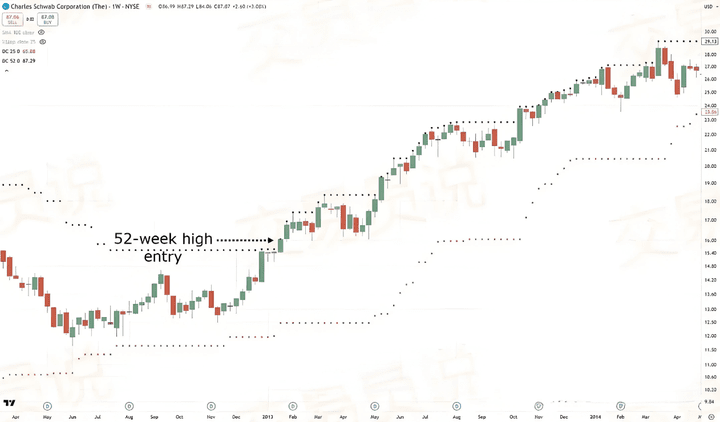
Maybe it's entering when a stock price hits a 52-week high...
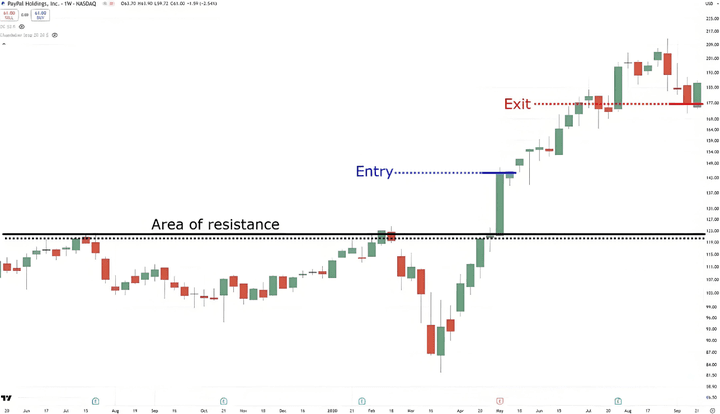
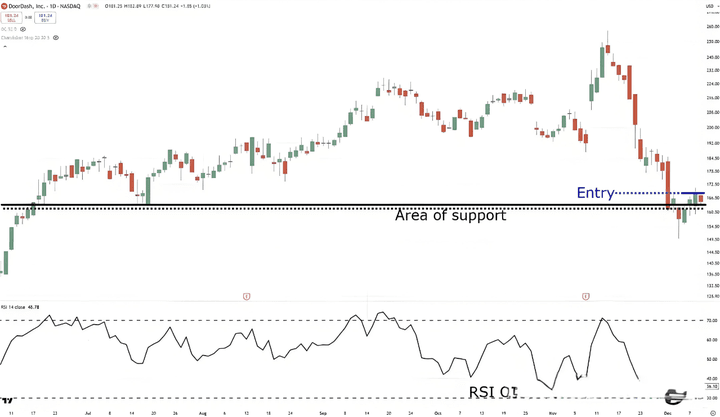
Or enter when breaking through an important resistance area...
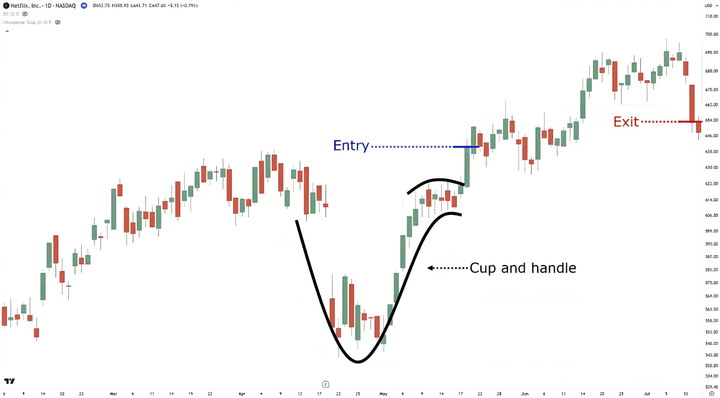
Or build a position when breaking free from the cup and handle pattern...
Although I have listed three scenarios in which breakout trading operates... they always follow a core logic: buy high and sell higher.
You must have often heard other traders say:
"Be sure to buy when the stock is oversold!"
"Buy low and sell high!"
"Be greedy when others are fearful, and fearful when others are greedy!"
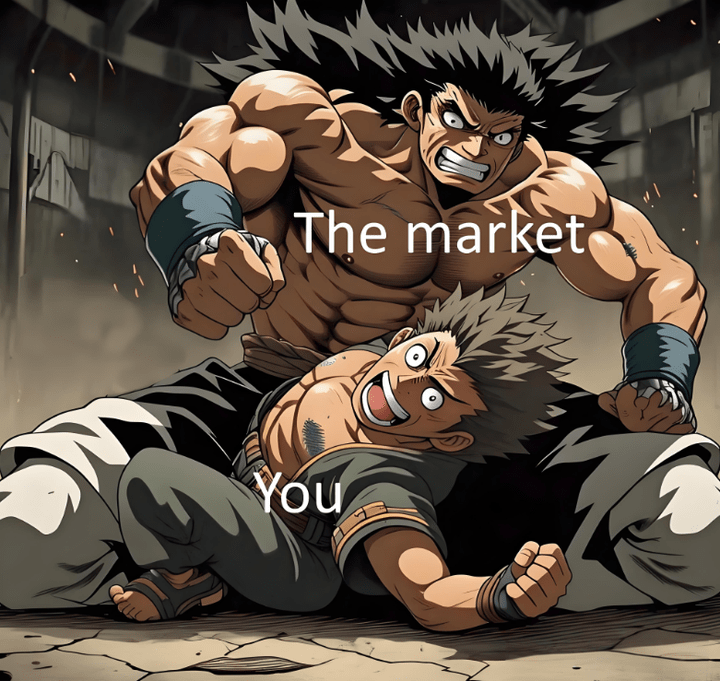
While this statement has its merits, chasing highs against the trend is a risky move!
Like catching a flying knife with bare hands, or like an anime character being knocked to the ground by a heavy punch!
Looking back, buying low and selling high can indeed bring generous returns. But even if you buy at a low point, the price may continue to bottom out.
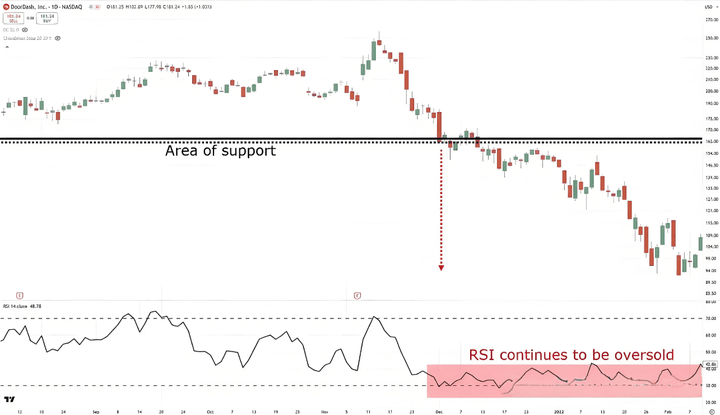
Can your resilience withstand such a blow?
This is the advantage of breakout trading.
Why choose breakout trading?
First, you don't fight the market momentum, but instead "ride" the established trend in a given direction. These trends can sometimes last for months or even years.
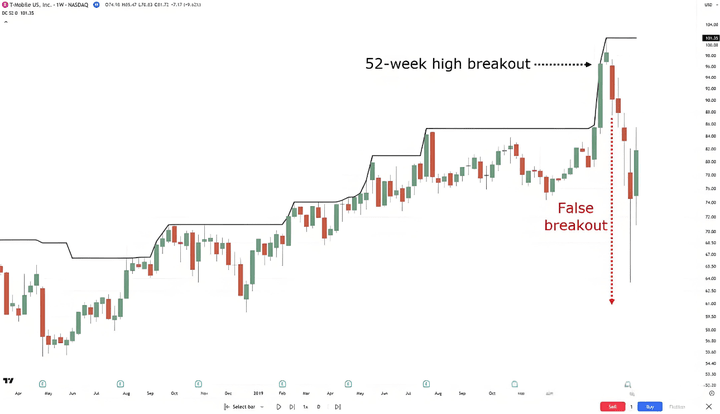
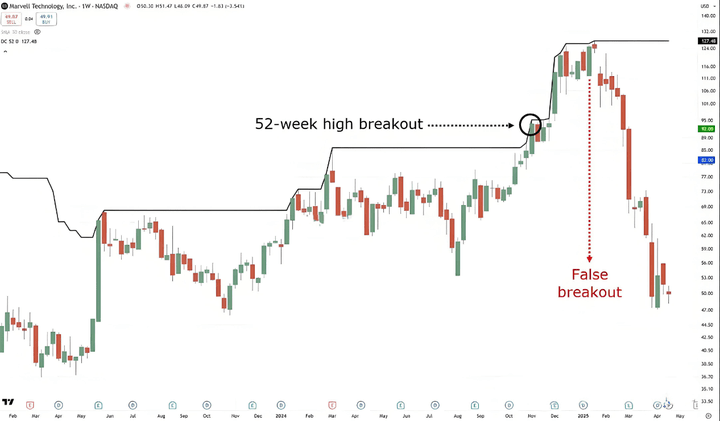
This allows you to capture amazing market fluctuations. Of course, breakout trading also has its drawbacks, such as the phenomenon of "false breakouts" occurring from time to time.
No strategy is perfect!
At this moment, you may be thinking:
"Which one is better?"
"Chase the highs to sell even higher, or buy the bottoms to sell at a higher price?"
The key is: all strategies have advantages and disadvantages, but the core is to amplify the advantages and make up for the disadvantages.
This is exactly what will be discussed next.
Breakthrough trading profit secret
Before sharing advanced operation tips, there is still a key element that needs to be emphasized.
Why choose the stock market for breakout trading?
The fundamental reason is: the stock market can provide richer trading opportunities.
Take the one-year heat map of the foreign exchange market as an example...
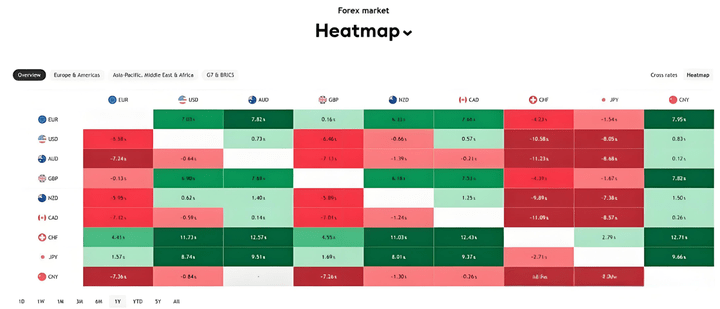
See the instability of the performance?
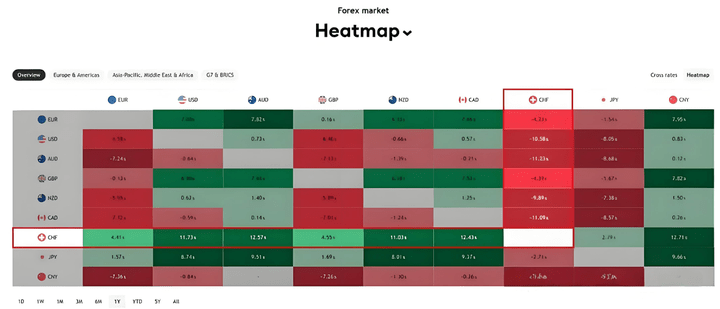
It is necessary to precisely lock in strongly performing currency pairs to carry out breakout trading. Even so, trading opportunities are still very limited - for example, going long on preferred Swiss franc related currencies, while focusing on shorting Japanese yen currencies......
But when observing the 1-year heat map of the Russell 3000 index...
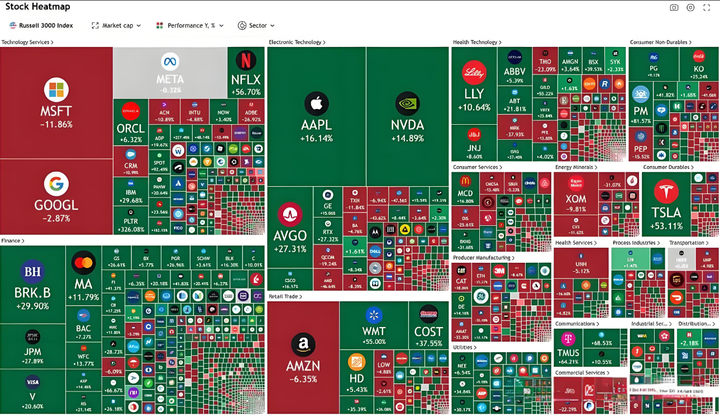
The number of stocks is indeed huge!
But this time, you can more easily identify which stocks are performing well and which are performing poorly.
You can even effortlessly discover that Apple (AAPL) and Nvidia (NVDA) are significantly highlighted in the heat map.
Got it?
This is the key to why stock market trading and breakout strategies complement each other - more opportunities, clearer trends, and potentially greater profits.
So the next question is:
How to take full advantage of this vast market?
The three advanced tips I am about to share are:
◎ Follow the overall market trend
◎ Adopt a moving stop-loss strategy
◎ Strictly implement risk management and position sizing
Advanced Tip #1: Go with the trend
We have to admit:
When the overall market performs well, everything seems to go smoothly...
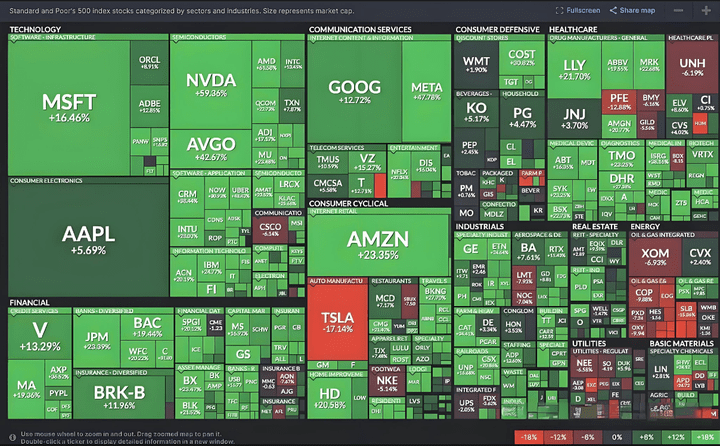
As shown in the heat map, the entire market is like a vibrant ocean, with almost all stocks showing an upward trend!
But when panic spreads, the market becomes a bloodbath...
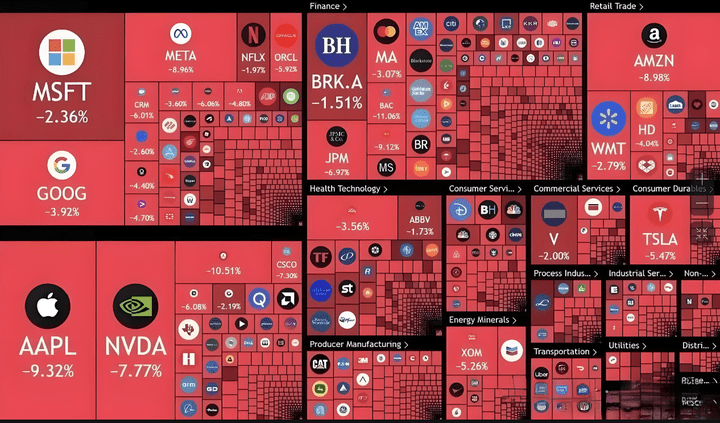
It should be noted that the two heat maps I showed are selected extreme examples.
But this is precisely to highlight a key phenomenon: trending markets are prevalent in the stock market.
So how exactly do you do it?
Very simple - always be on the right side of the market!
Bull market => Go long
Bear market => Hold cash
The logic is clear, isn't it?
But you might ask:
When should I go long?
When should I hold cash and stand aside?
Is there a quantifiable reference standard?
At this time, you can use a tried and tested indicator - the index filter.
Instead of spending energy reading hundreds of financial reports to determine whether to hold cash, it is better to adopt an index filtering mechanism.
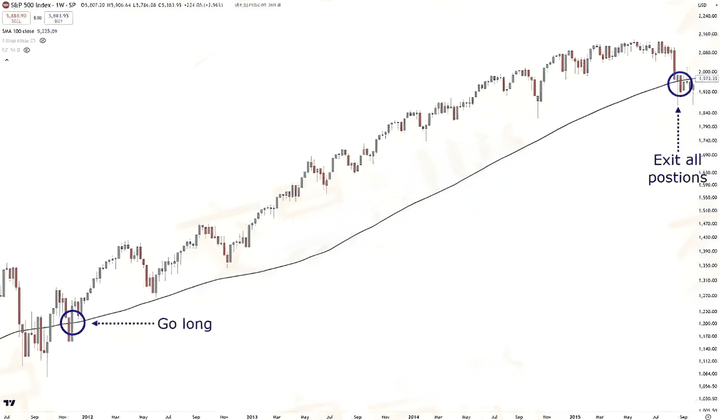
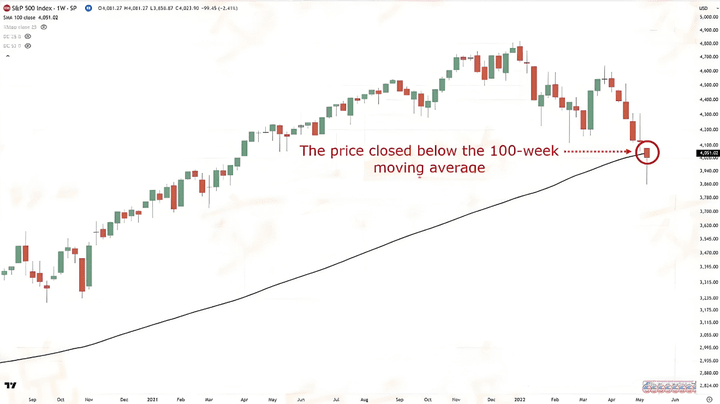
For example, when trading the S&P 500 index, load the 100-week moving average on the chart:
◎ When the closing price is above the 100-week moving average => Start looking for trading opportunities
◎ When the closing price falls below the moving average => Immediately liquidate and hold cash
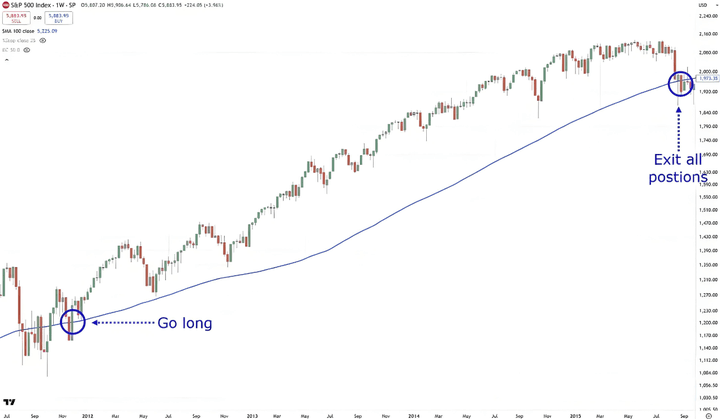
Although the signals are occasionally ambiguous, this system allows you to clearly grasp the direction of the market tides, both increasing profits and controlling losses.
Let me do some data verification for you
This is the performance of a S&P 500 stock trend-following system without an index filter...
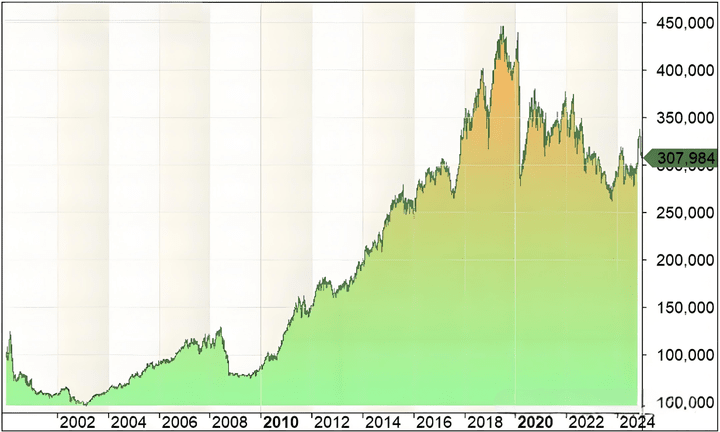
Of course, it can make money in the market, but what are the results?
Not ideal!
But what happens when you add an index filter to it, using the same rules, etc.?...
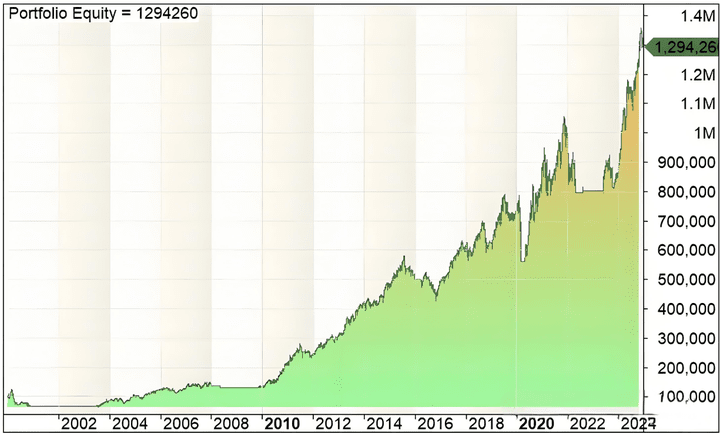
Look, a world of difference.
And all of this requires only adding an index filter rule!
So now you know when to trade and when not to trade.
So, how do you know when to exit a trade?
Let me share it with you next...
Advanced Tip #2: Use Trailing Stop Loss
Now, you understand that the goal is to buy high in a trend and sell higher before the trend ends.
Of course, sometimes the breakout may be short-lived, you make a little profit, and then the market reverses against you...
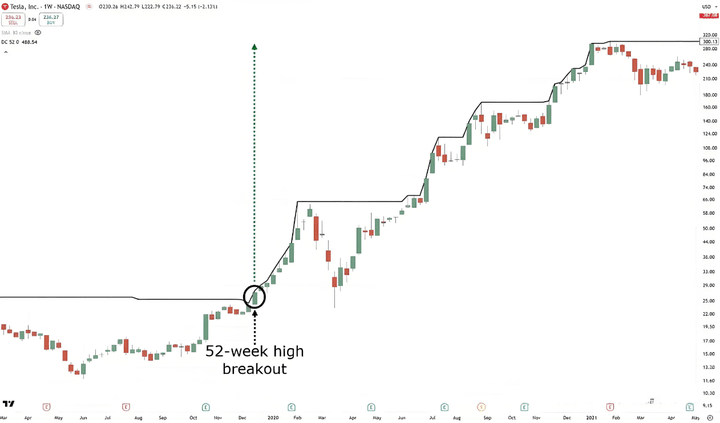
But at the same time, there may also be huge trends like this that seem to have no upper limit...
Overall, in breakout trading, it's important that you never know how high the price can go.
There are many different ways to track your stop loss, such as using moving averages, Donchian channels, or Average True Range (ATR) indicators...
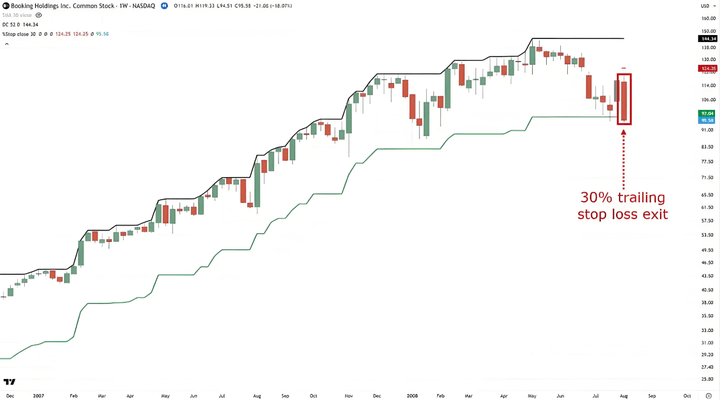
However, I am going to share with you a simple yet practical and effective trailing stop loss method - percentage-based trailing stop loss!
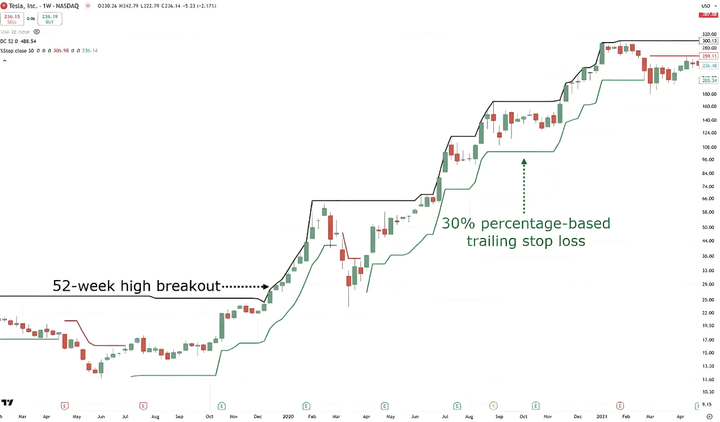
Using this method means you will hold the stock until it has fallen 30% from its high, for example...
Isn't it simple? No need to remember fancy formulas, just basic math!
Now, if you want to capture short-term trends, then you can use a percentage-based trailing stop loss of 10% to 20%.
But if you are trying to grasp the principle of long-term big trends, then you will want to consider using a ratio of 30% or higher.
But please note! The market never runs according to an ideal script. It often reverses the moment you buy, or crashes after hitting the profit target!
So, how to remedy it? How to increase the odds of breakout trading?
Let me share one last advanced tip with you.
Advanced Tip #3: Risk Management and Position Sizing
You must recognize the reality that all trades may encounter adverse fluctuations, and breakout failures will eventually occur.
But you can think of it as a "cost of doing business".
The good news is that portfolio management can effectively control losses: portfolio diversification (in plain language: holding multiple underlying assets at the same time):
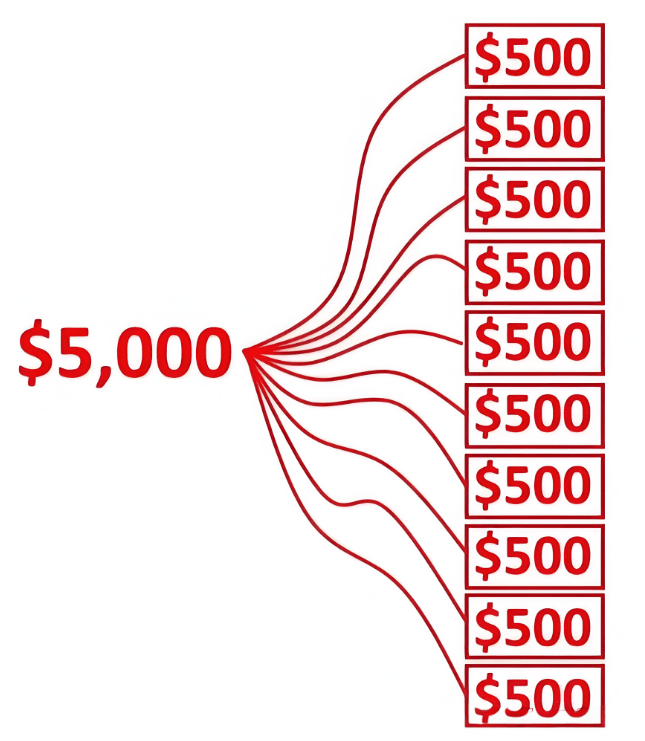
For example, if you have a $5,000 account and you have a 10% portfolio allocation rule.
This means that you will not buy stocks worth more than $500 and hold a maximum of 10 open trading positions at the same time.
The core logic of doing this is that you can never predict which stock will explode or collapse.
Through portfolio allocation, even if a stock goes to zero, you still have funds to continue trading.
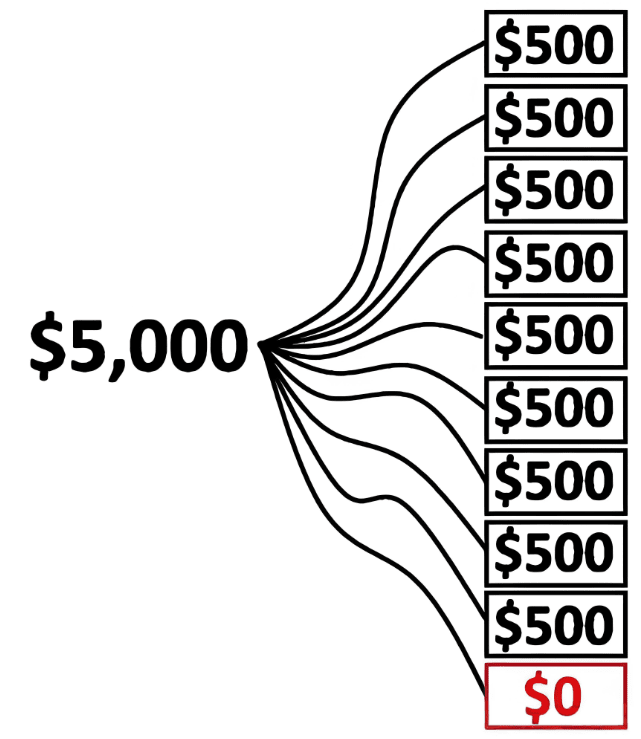
At the same time, by holding multiple stocks in your portfolio, you have a good chance of capturing long-term breakouts in the market.
Even if only 1-2 stocks are profitable, it is enough for your portfolio to turn losses into profits or more.
At this point, you have mastered the underlying logic and practical essence of breakout trading, making you a breakout trading expert!
Breakout trading system verified by backtesting. The most valuable part of this guide is here - a complete breakout trading strategy and historical backtesting results.
An effective breakout trading system
This is what makes this guide special.
A complete breakout trading strategy and its complete backtesting results, showing you how it performs in the stock market.
Of course, past performance is never indicative of future results.
But let me ask you:
If a system has performed poorly in the past, would you still trade it?
Definitely not, right?
And that's exactly what I want you to understand.
This breakout strategy has generated a return of 5175.77% over the past 30 years.
However, before starting, you need to understand a few important details about this breakout trading system:
◎ The system only trades on the weekly time frame
◎ The system is tested for trading S&P 500 index components, while using the index itself as a trend filter.
◎ The system uses a 10% portfolio allocation, which allows you to hold a maximum of 10 stocks (remember what I taught you earlier?)
Now, let's analyze the trading rules of this system together.
Rule 1: The S&P 500 index is above the 100-week moving average
Remember the concept I taught you earlier?
This is the core pillar of this system.
But as a review, you just need to pull up a 100-period simple moving average and switch to the weekly time frame...
As long as the price is above the moving average, continue to hold the position or open a new position according to the rules.
Very basic, right?
So, what to look at next?
Rule 2: When a stock hits a 52-week high, buy at the opening price of the next week.
If a stock hits a 52-week high, buy the stock at the opening of the next week.
This rule is almost self-explanatory.
However, the difficulty here lies in continuously finding all-time highs.
There are about 500 stocks in the index we trade.
Manually checking all these stocks every week is crazy!
So, what is the solution?
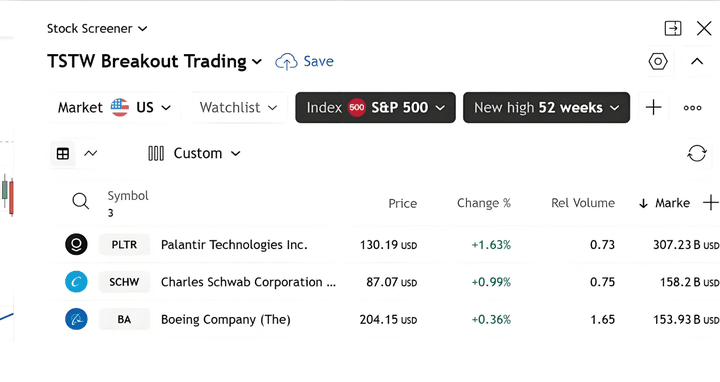
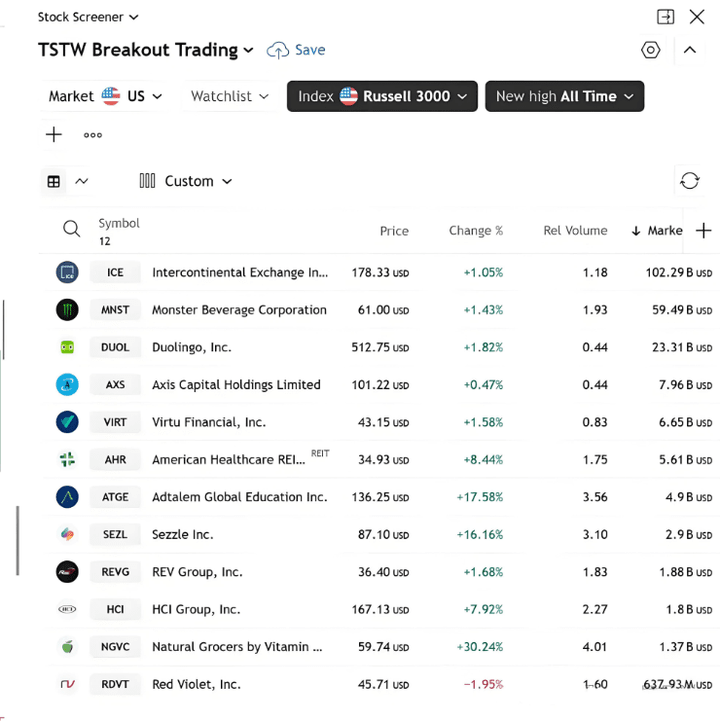
That's using a "stock screener".
Fortunately, the rules are simple enough that you can use a few free screeners to implement them.
One of the screeners is through TradingView!
Rule 3: Sort stocks according to the 80-week rate of change indicator and prioritize trading the top-ranked ones.
This step may be relatively new. We will use a ranking tool called "Rate of Change (ROC)".
The rate of change indicator is presented in the chart as follows...
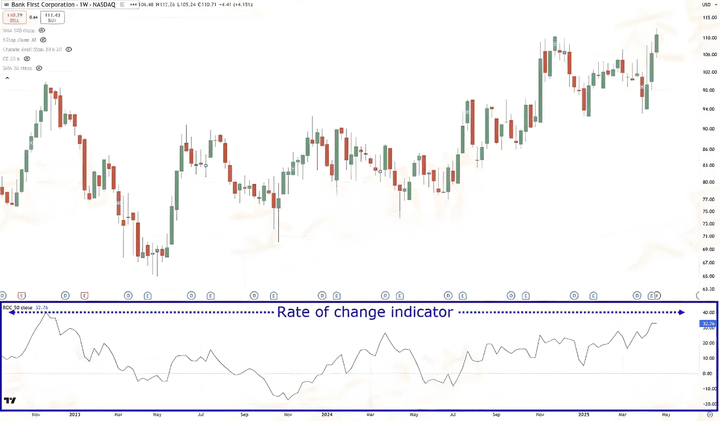
The core function of this indicator is to measure the strength of a stock.
It does not show overbought or oversold conditions - in short, the higher the ROC value, the stronger the stock's momentum, and that's exactly what we need!
Based on the previously shared screener results (showing stocks that closed at 52-week highs)...
Now you need to review these stocks one by one and record their 80-week rate of change values.
Here are example values...
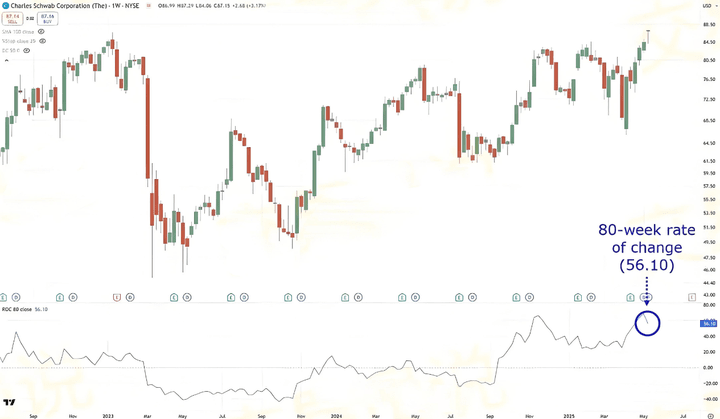
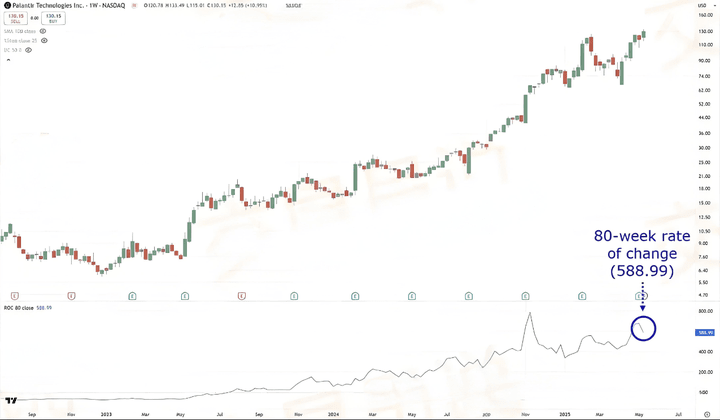
According to ROC ranking, PLTR should be prioritized for trading, followed by SCHW, and finally BA.
Fortunately, the number of screening results this time is not large.
But be aware that sometimes the screening results can be as many as dozens...
At this time, you may hesitate: "Should I buy everything?"
Absolutely not! Remember the two iron laws:
◎ The maximum number of positions is 10
◎ No single stock position should exceed 10% of the total capital
This is the importance of ROC sorting - it clarifies trading priorities.
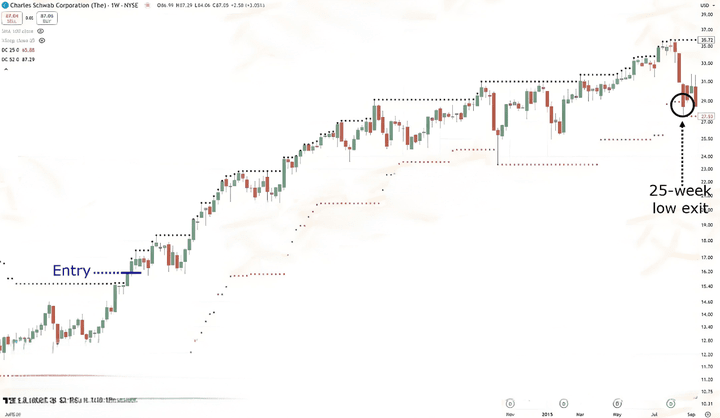
Rule 4: When a stock's closing price falls below the 25-week low, sell at the opening of the next week.
For this rule, you can simply use the Donchian Channel, which only shows the lower channel...
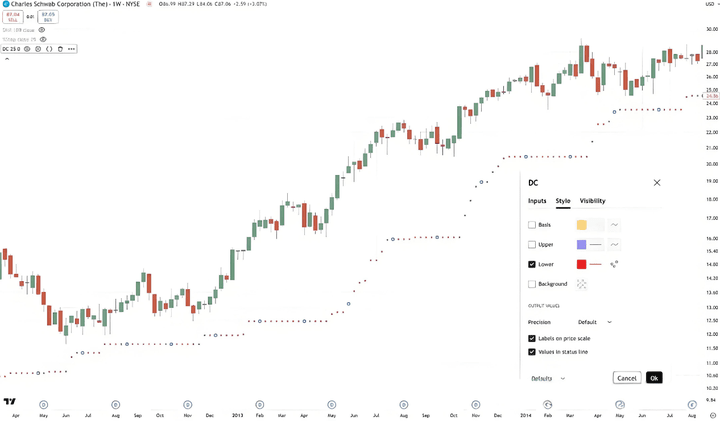
The parameter is set to 25 weeks...
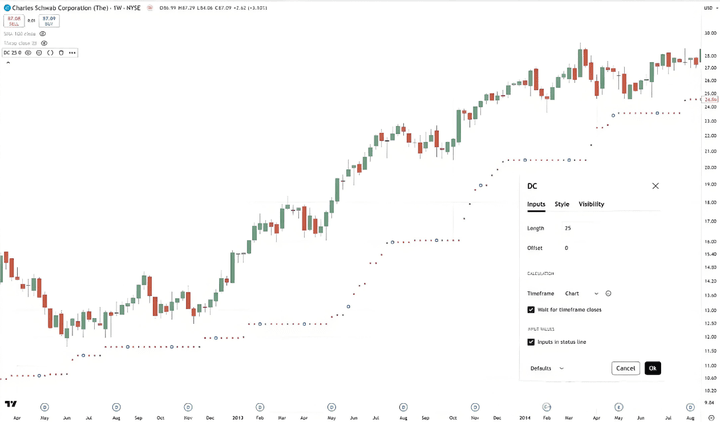
Again, all operations are based on weekly charts.
For example: When the stocks you hold are making substantial profits...
Only when the closing price falls below the 25-week low will it trigger an exit...
The rules are very clear, right!
So, what about the exit?
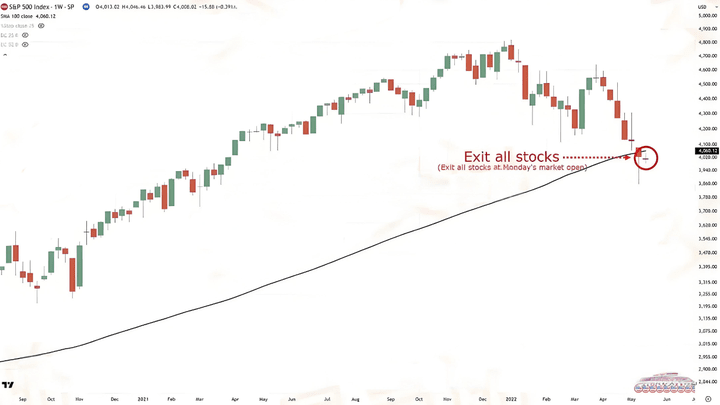
Rule 5: If the weekly closing price of the S&P 500 index is below the 100-week moving average, liquidate the position at the opening of the next week.
When the market is good, hold firmly.
But what if the index breaks below the 100-week moving average?
Very simple, assuming the closing price on Friday breaks below the moving average...
Immediately close all positions and stand aside in cash on the opening of the next Monday...
Understood?
Now comes the key question: How does this system actually perform in real combat? What is the average annual return?
Next, you will witness the real "trading edge" firsthand.
Breakout trading system backtesting results
As you know, this is a rule-based objective trading system. This means that historical data backtesting verification can be performed.
Testing period: 1995 to 2024
The amount of data is indeed amazing!
This system has withstood the test of many major crises: the 1997 Asian Financial Crisis, the 2008 Global Financial Tsunami, the 2020 COVID-19 pandemic impact, and even the Russian-Ukrainian war - all survived safely and continued to make profits.
Here are the core performance data:
◎ Total Trades: 320
◎ Average Annual Return: 13%
◎ Maximum Drawdown: -12%
◎ Win Rate: 50%
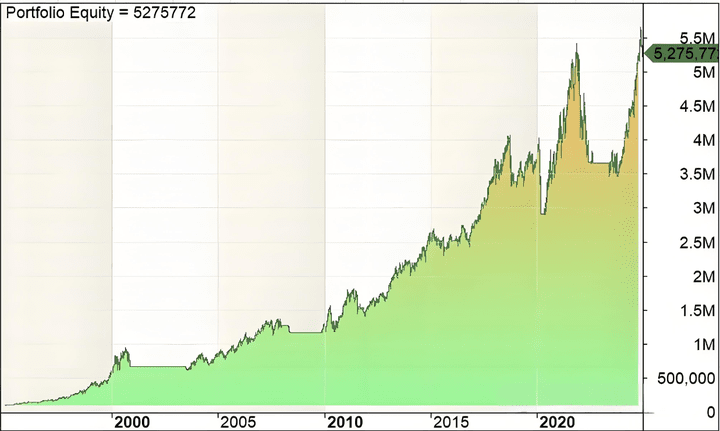
As you can see, the breakout trading system has had 5 losing years in the past 30 years.
But the performance is still quite remarkable.
Now, although this system earns an average of 14.13% per year, it is not constant every year.
There are highlights like 2024, and there are difficult times like 2022.
So, to supplement the system's performance in difficult times, here is an additional underwater equity curve:
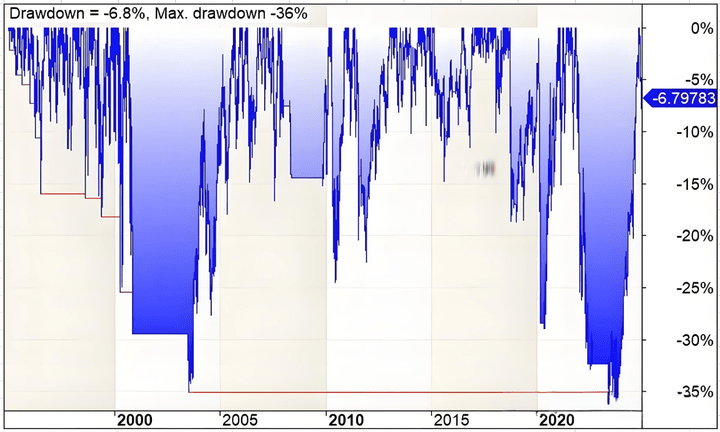
This curve clearly shows the frequency and magnitude of loss cycles, so be prepared!#美SEC批准流动性质押
That's it, a complete breakout trading system with a quantifiable edge in the market!#特朗普加密新政
But of course... learning a strategy is one thing, but consistently executing it is the difficult part.
When you encounter a series of losses, you will inevitably have various doubts:
"Why choose this indicator?"
"Should I adjust the parameters?"
"Can it be combined with other strategies?"
Therefore, a special FAQ section is set up:
Frequently Asked Questions
Finally, here are some frequently asked questions about breakout trading:
1. What type of order do I use to enter a trade?
In this case, you will want to use a market order to enter.
2. If the 25-week low is touched during the week (between Tuesday and Friday), do I exit the trade immediately, or do I wait for the weekly candlestick to close?
Wait for the weekly candlestick to close. Once the weekly candlestick closes, on Saturday, if the closing price is higher than the 25-week low, you hold the trade. If it is lower than it, then you exit the trade on Monday.#美联储比特币储备
3. If the S&P 500 index returns above the 100-week moving average during the week, do I immediately buy stocks that meet my criteria, or do I wait for the weekly candlestick to close?
In this case, wait for the weekly candlestick to close. If the S&P 500 closing price is higher than the 100-week moving average, then you buy stocks according to the trading rules. If not, then remain holding cash.
4. Why do you use the S&P 500 index instead of the Russell 3000 index?
No particular reason. You can use the Russell 3000 index and the trading system still works!
5. Regarding the 100-week moving average, do I use a simple moving average or an exponential moving average?
Although I use the Simple Moving Average (SMA), it doesn't matter which one you use. The concept behind it is key, not the parameters. If a trading system fails due to minor parameter changes, I would be very worried because it indicates that it is likely overfitted.
6. Is the breakout trading system suitable for shorting using the opposite trading rules, i.e. shorting stocks at historical lows?
I backtested this and unfortunately, it didn't work.
No matter how diligent a fisherman is, he will not go out to sea to fish in the season of storms, but will carefully guard his fishing boat. This season will always pass, and a sunny day will always come! Follow me, I will give you fish and teach you how to fish. The door of the cryptocurrency circle is always open. Following the trend can lead to a smooth life. Collect it and keep it in mind!