Kaspa price has been holding steady after bouncing off support, but it’s still stuck inside a tightening symmetrical triangle. The setup is leaning slightly bullish, though sellers are still putting up a fight at the top.
Earlier this month, the price dipped to the $0.085 zone before buyers stepped in. Now KAS is trading at $0.093757, sitting comfortably above its short-term moving average at $0.0879.
Let’s break down today’s setup.
What We Got Right Yesterday
In yesterday’s prediction, we talked about how clearing $0.091 could open the door for a move toward $0.095 and even $0.10–$0.11.
That’s exactly what’s happening now. Kaspa has pushed through $0.091 and is already testing the $0.096 area, edging closer to the $0.10 mark.
We also mentioned that $0.082 was the key level to hold on the downside. Price stayed well above that, keeping the bullish structure intact.
Kaspa Daily Overview (August 9)
Current Price: $0.09375
24h Change: +3.54%
RSI (14): 53.44
Volume: Stable, with a slight uptick
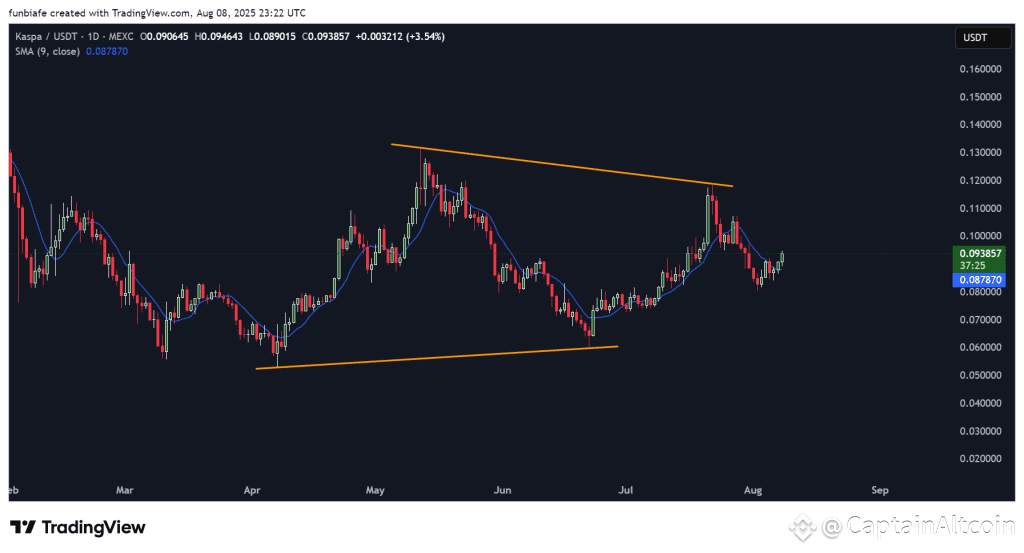
Kaspa chart and indicators are still signaling a contracting wedge pattern, with higher lows meeting lower highs. Support sits near $0.080, while the top of the wedge is around $0.112–$0.120.
What the Kaspa Chart Is Showing
On the daily chart, KAS price is grinding higher but hasn’t broken out yet. The $0.096–$0.10 range is acting as the first big wall for buyers. If that goes, the next targets are $0.105–$0.110, then the key breakout zone at $0.112–$0.120.
 Source: TradingView
If price slips, look for support at $0.091–$0.092, then $0.087–$0.088. A break under $0.080 would kill the bullish wedge pattern.
Technical Indicators (Daily)
Indicator Value Signal MACD (12,26) 0.001 Just turned bullish ADX (14) 25.45 Trend is strengthening CCI (14) 8.28 Price near its average RSI (14) 53.44 Slight bullish bias ROC -6.20 Short-term dip in momentum Bull/Bear Power (13) 0.0016 Buyers have a small edge
Summary: Overall, most signals are leaning bullish, but the ROC is hinting at a bit of short-term weakness.
Kaspa Price Scenarios
Bullish Scenario:
A close above $0.10 could send KAS toward $0.105–$0.110, with a shot at breaking $0.112–$0.120.
Neutral Scenario:
If KAS price holds $0.10 as resistance, expect more sideways chop between $0.085 and $0.10.
Bearish Scenario:
Losing $0.087 could trigger a drop toward $0.084–$0.085, and possibly $0.080.
Bottom Line
Kaspa price looked stronger but still hasn’t made its breakout move. $0.10 is the big number to watch for bulls, while $0.080 is the line in the sand for bears.
Read Also: How Much Could 12,750 Kaspa (KAS) Tokens Be Worth by 2026?
Subscribe to our YouTube channel for daily crypto updates, market insights, and expert analysis.
The post Kaspa (KAS) Price Prediction for Today (August 9) appeared first on CaptainAltcoin.
