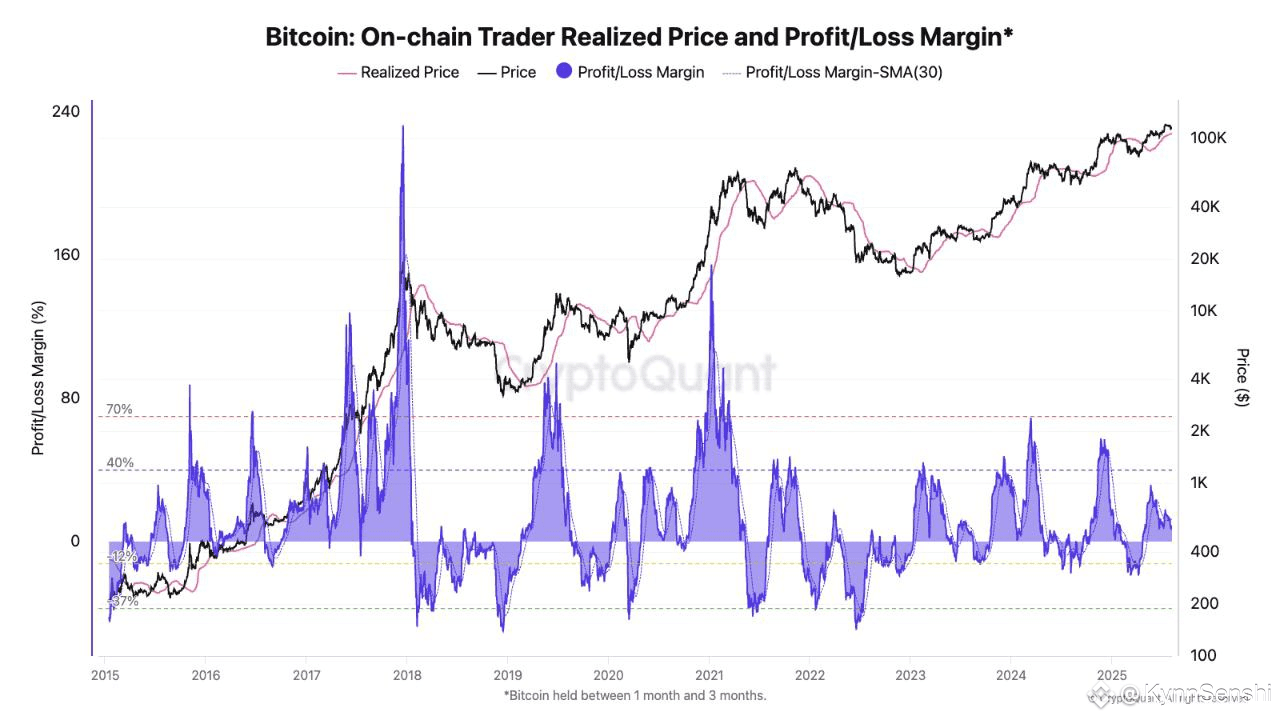
The chart below shows the relationship between Bitcoin's Realized Price and Profit/Loss Margin for traders holding BTC for 1–3 months.
BTC price = black line, realized price for 1–3-month holders = pink line. The purple area shows the profit/loss margin. The dotted lines mark the following levels: 70% euphoria, 40% optimism, and -12% to -37% capitulation.
This indicator helps read sentiment and market cycle positions. Very high profit/loss margins are usually followed by large corrections, while extreme negative margins often coincide with market bottoms.
From the chart, we can see that Bitcoin holders with 1–3 months remaining are in a healthy profit position of +400–500%, far from the capitulation loss zone. This level is also still below the 70%+ euphoria zone that typically appears at the peak of a bullrun. This indicates that the trend is still bullish and there is potential for further price increases before the mania phase.