
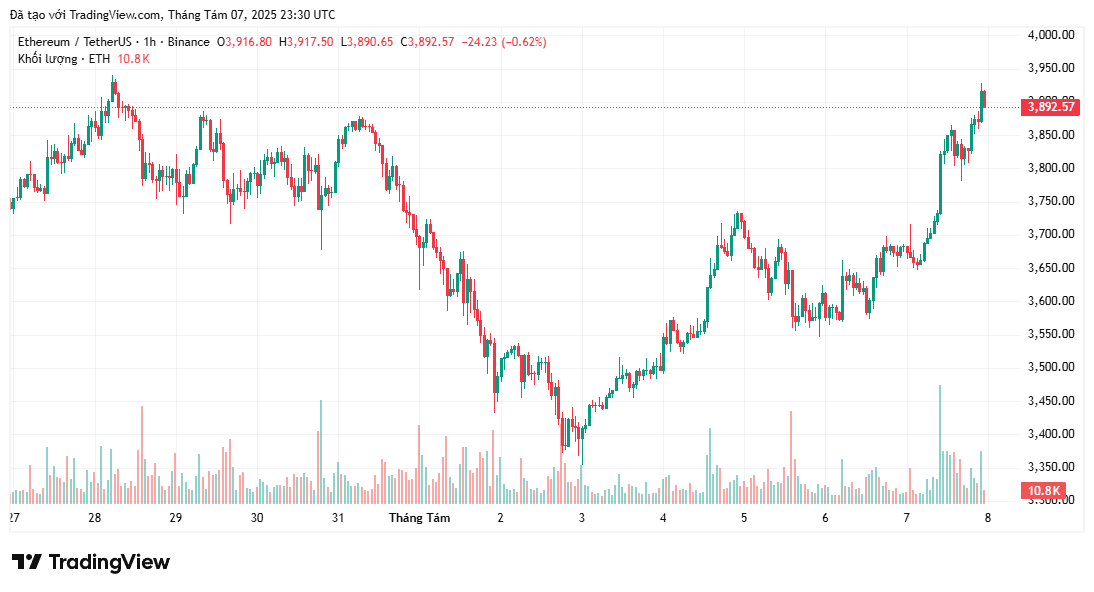
Ethereum has recorded an increase of nearly 3% in the past 24 hours, and the weekly loss has been adjusted down to just 3.5%. With the current price nearing the psychological threshold of $4,000, both technical indicators and on-chain data show positive signs for a breakout not far off.
The Return of Accumulation by Short-Term Investors
One of the reliable methods to assess upcoming momentum is to monitor the wallet activity of short-term investors. These are addresses that have held Ethereum for a period of 1 to 3 months, often associated with new accumulation.
Data from the HODL wave shows that the percentage of these addresses has surged from 9.57% to 11.93% in less than a month, indicating renewed buying activity.
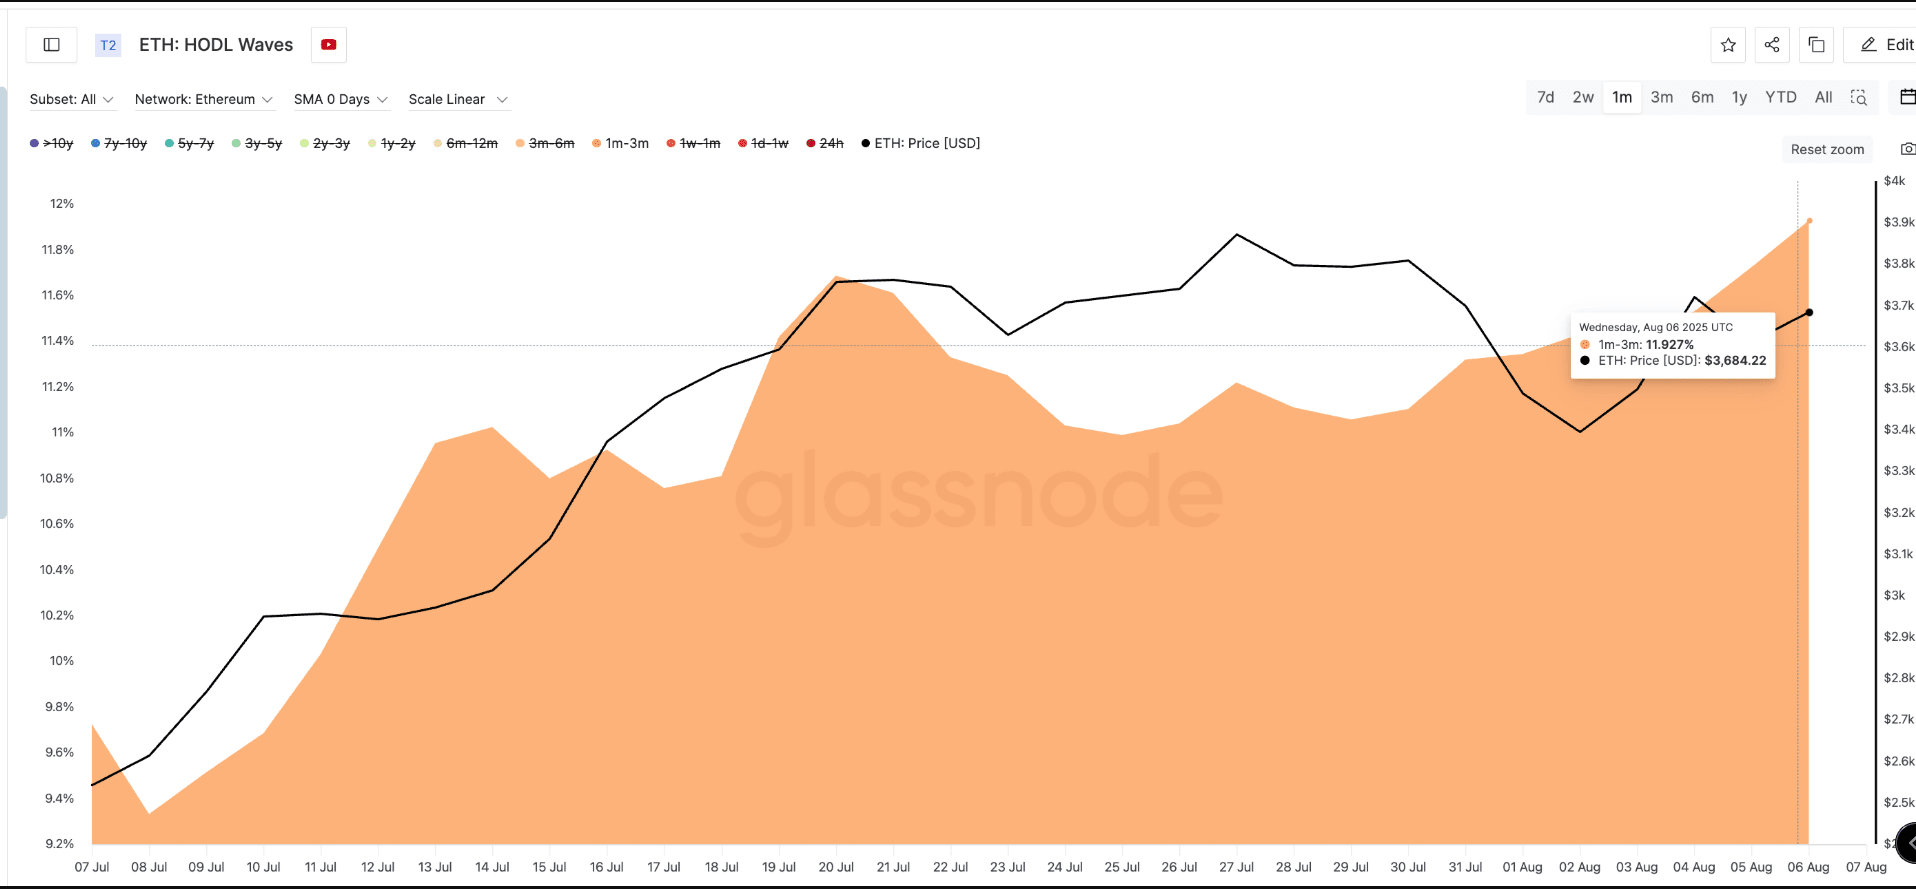
These investors often participate during consolidation phases and play a crucial role in initiating breakout movements.
HODL Waves show the percentage of Ethereum supply held over different time periods, with the 1–3 month group particularly important for identifying accumulation activity during transitional phases.
SOPR Suggests Selling Pressure is Losing Momentum
Supporting this buying activity is the behavior of the SOPR index, or Spent Output Profit Ratio. This index tracks the profit/loss status of sold coins. A declining SOPR, while the price remains stable or increases, is often a sign that profit-taking has slowed down.
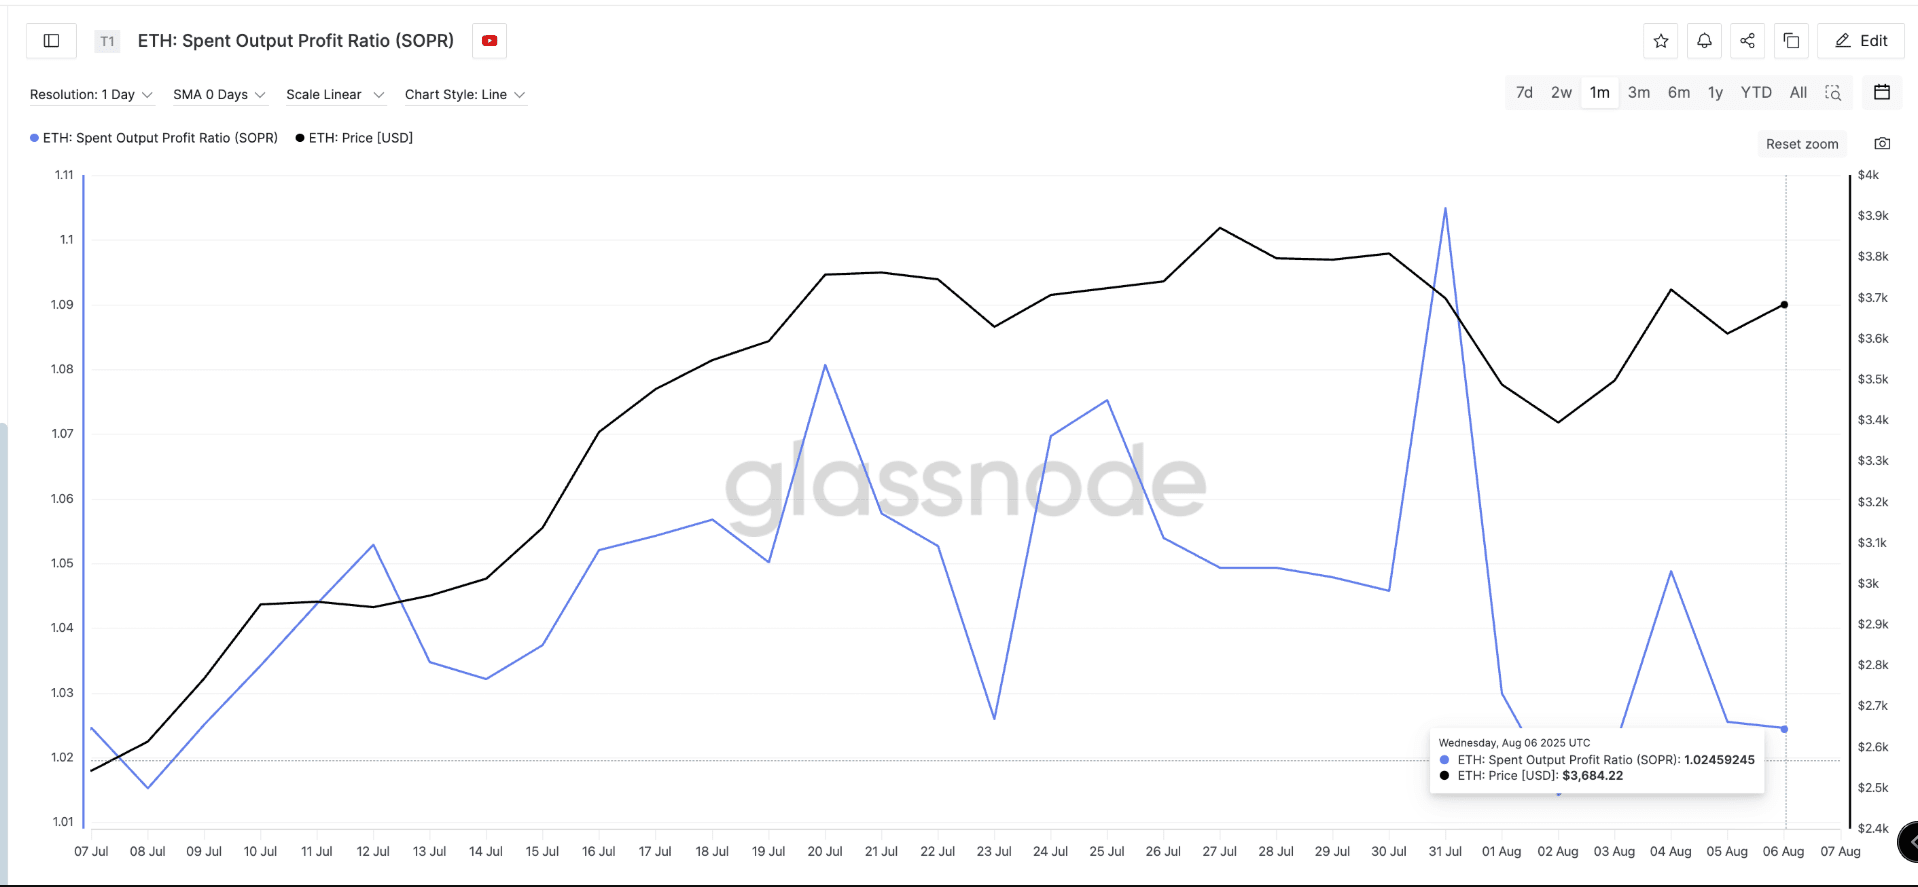
Currently, SOPR is trending downwards, even as the price of Ethereum has slightly increased. The last time a similar situation occurred was in late July, when ETH quickly gained momentum thereafter. This is a typical bottoming pattern. If this trend continues, it will reinforce the belief that the $4,000 threshold is well within reach.
SOPR helps measure market confidence; when sellers do not take profits despite rising prices, this indicates increasing confidence in the potential for further price increases.
Resistance is Gradually Decreasing as Buyers Enter; Is This Good for Ethereum's Price Action?
On-chain data from IntoTheBlock's Global In/Out of the Money model shows that the current resistance area is weak. Only 11.95 million addresses are positioned right above the current price of Ethereum at $3,720, indicating few investors are in a position to sell at breakeven, reducing the likelihood of encountering strong resistance between the current level and the threshold of $3,937.
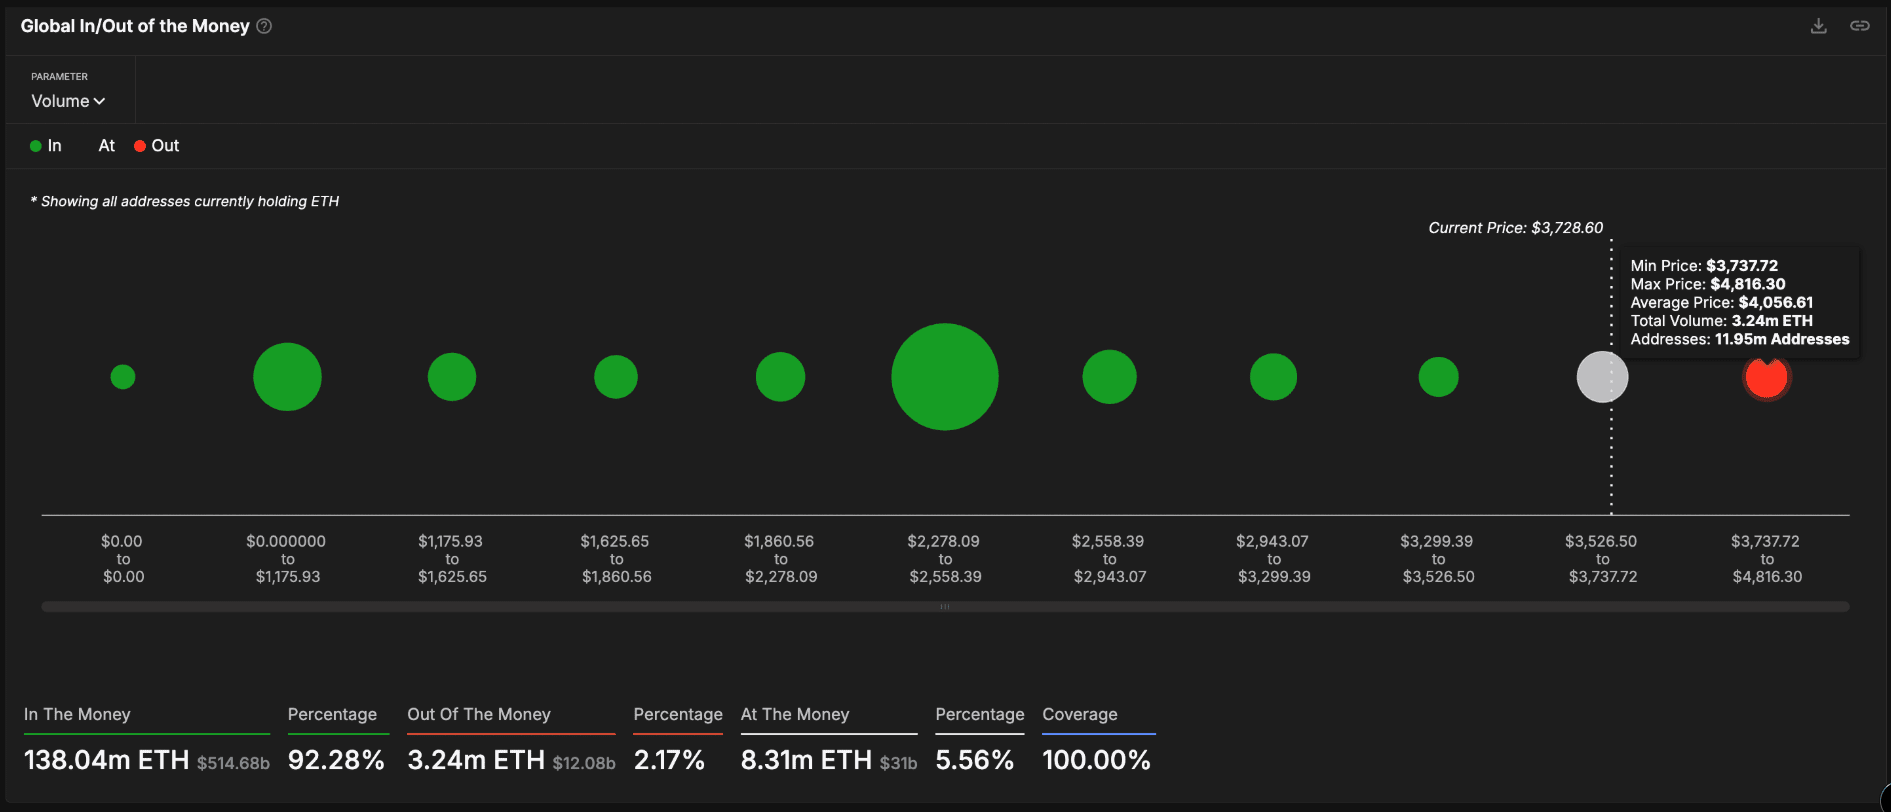
The price level of $3,937 is very important according to the weekly price chart. In previous cycles, Ethereum was rejected near the $4,100 level in March 2024 and twice in December 2024.
However, this time, ETH's price has not tested the $4,000 level, although it has remained above $3,300 since June. This makes a retest of the $4,000 level very necessary.
Note: A weekly chart is used to filter out movements within a range; something that ETH has been stuck in for a long time.
If Ethereum convincingly surpasses the $3,937 threshold, a lack of selling pressure at this level will increase the likelihood of a surge past $4,000. However, if selling pressure increases with a declining SOPR alongside price adjustments, or if short-term investors turn into sellers, the $3,335 level will be a crucial point to monitor. A breach below this level, especially on larger time frames, could shift the structure to bearish, invalidating the current hypothesis.