
Dogecoin is maintaining a bullish market structure as it trades at $0.2369, marking a 6.15% increase in 24 hours. The cryptocurrency has risen 18.42% over the past week, signaling new buying momentum. Trading analyst Tardigrade notes that the monthly chart shows Dogecoin still maintains a well-structured Ascending Broadening Wedge pattern.
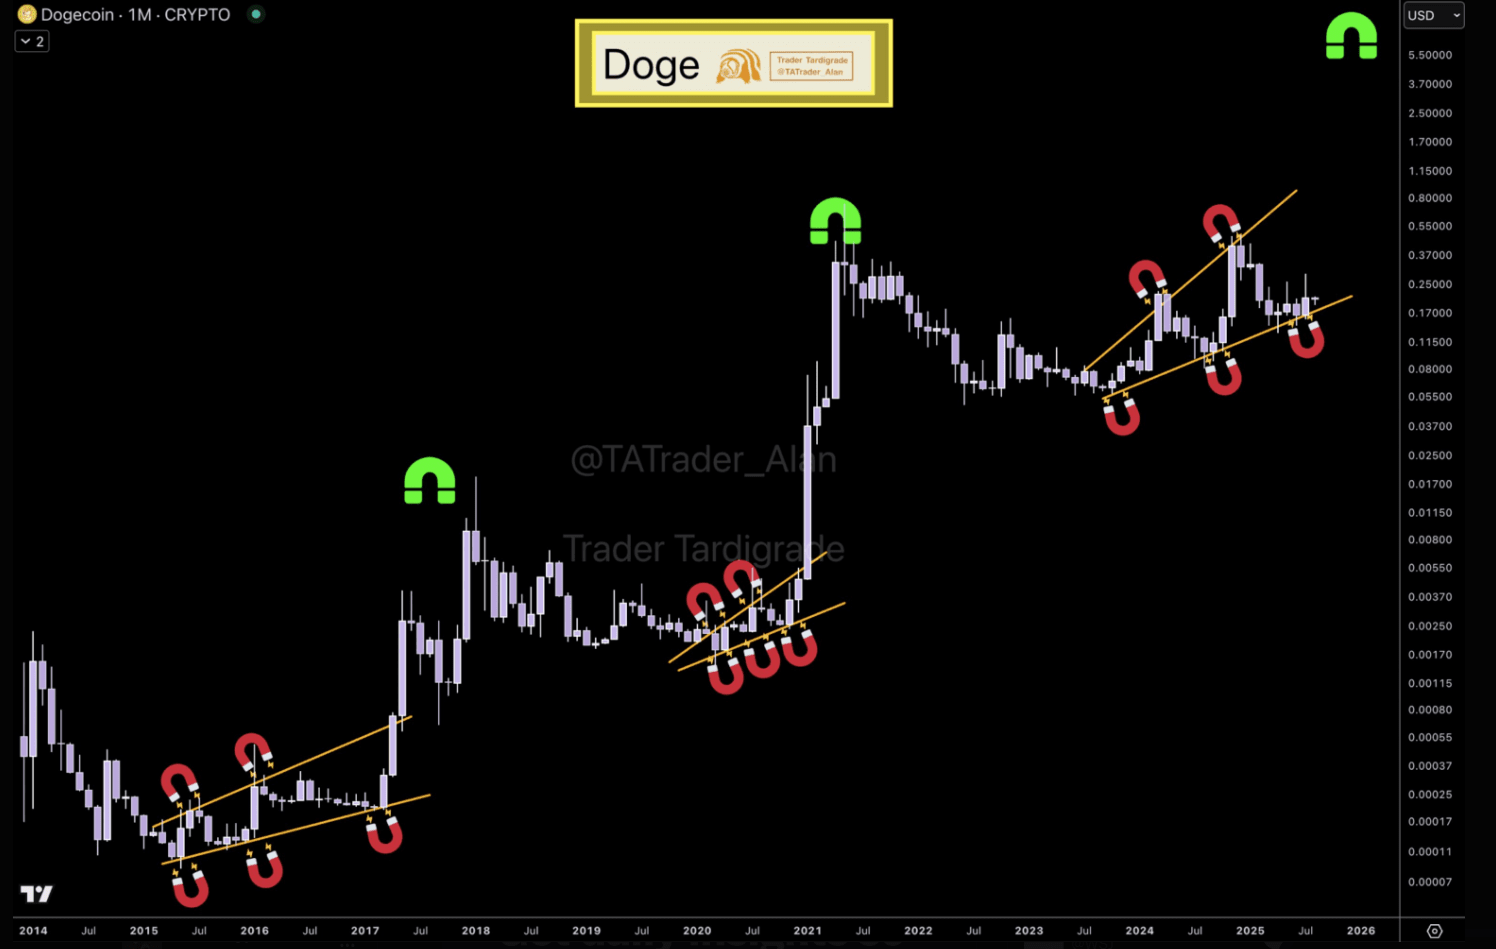
This pattern reflects historical setups preceding significant price increases, with the upper boundary acting as a potential target area.
Important Technical Developments
The 20-month simple moving average (SMA) has transitioned from a resistance level to a support level, now serving as a strong bullish foundation. Price action has also confirmed a successful retest of the breakdown from the descending broadening wedge pattern on the bi-weekly chart.
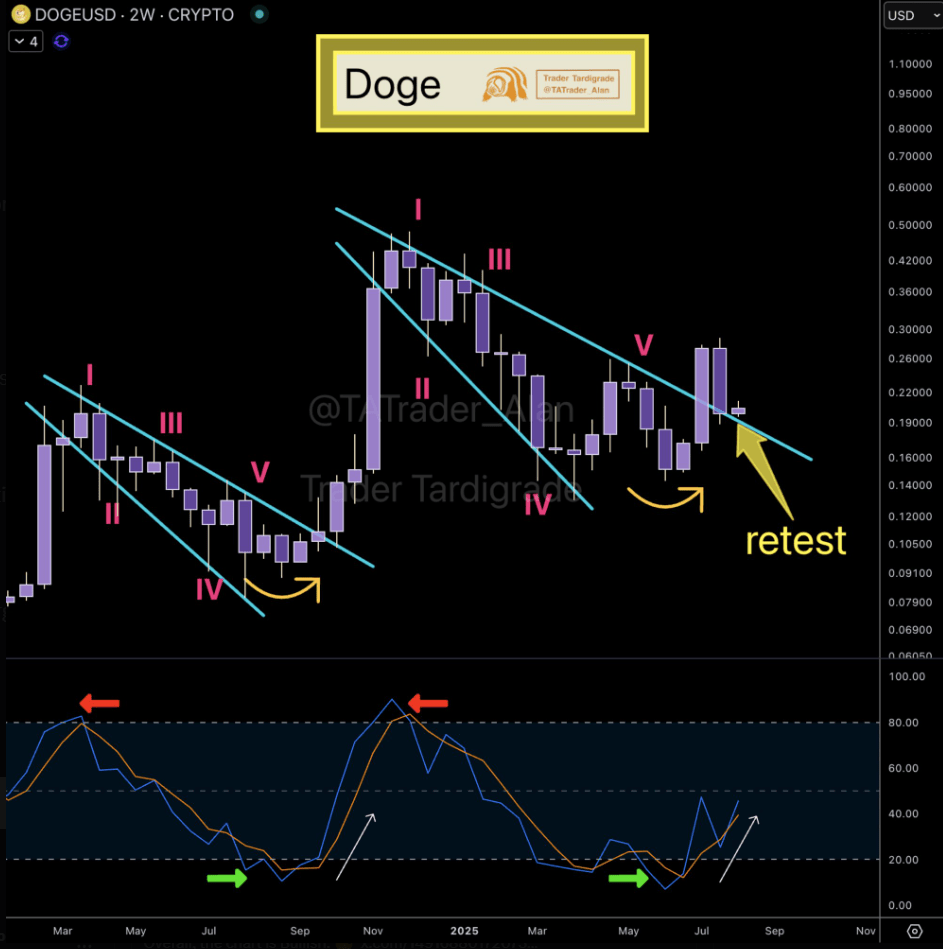
Long-term momentum is supported by stochastic indicators moving up from oversold conditions, highlighting the potential for further bullish advances.
Hourly chart data shows DOGE continuing its upward momentum, trading at $0.24043 after a 1.07% increase in the past hour. The price is holding above the Supertrend support level at $0.23202, confirming the potential for upward control.
The MACD line remains above the signal line with positive histogram bars, signaling ongoing buying pressure.
RSI at 75.92 is entering overbought territory but still shows an upward trend, indicating strong momentum despite the potential for short-term pullbacks.
Market Position and Outlook
Derivatives market data shows significant trading activity, with volume up by 1.30% to $6.44 billion.
Open interest increased by 8.99% to $3.68 billion, while open interest in options surged by 476.65% to $1.26 million, reflecting rising speculative interest.
Buy positions are currently dominant, with Binance DOGE/USDT showing a buy/sell ratio of 3.0258 by account and 2.9469 by position.
On exchanges, the buy/sell ratio over 24 hours is 1.0064, signaling a balanced position but with a slight upward trend.
If the uptrend continues, DOGE could challenge higher resistance levels identified on both the weekly and monthly charts.
Analysts suggest that improving structural patterns and market metrics support the potential for prolonged bullishness.
