
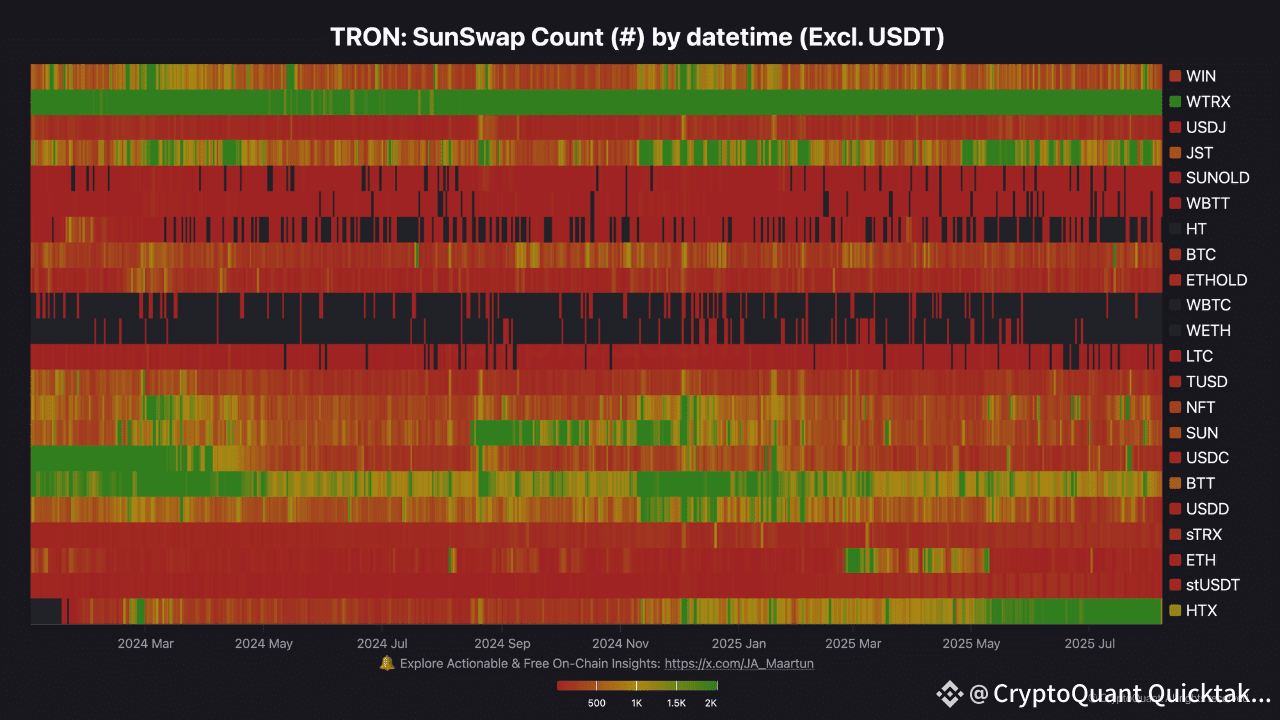
TRON’s DeFi activity is rapidly evolving, and SunSwap—the leading DEX on the network—offers valuable insight into user behavior. By analyzing the SunSwap swap count heatmap from January 2024 to July 2025 (excluding USDT), we can track how interest in specific tokens shifts over time and how these rotations may align with price movements.
The heatmap visualizes daily swap counts per token. Red means low activity, yellow moderate, and green high. Unlike volume, this metric shows how often tokens are swapped—revealing shifts in user attention and engagement.
WTRX remains consistently active throughout the period, acting as the backbone of TRON’s DeFi landscape. JST, on the other hand, shows a surge in swap activity between November 2024 and March 2025, which aligns with a +200% price rally. This suggests that rising swap activity can coincide with strong upward trends. However, such periods often signal the late stages of hype cycles—where rapid gains are followed by cooling off. Recognizing these phases can help traders capture quick profits and identify when to reduce exposure.
The chart starts in January 2024, allowing full-cycle visibility. HTX shows growing activity from early 2025, peaking in July. This may reflect speculative interest or yield farming campaigns. However, when swap frequency grows too fast, the risk of sharp reversals also rises—as seen with several tokens post-peak.
Tokens like sTRX, USDC, and NFT show short bursts of activity, while ETH, WBTC, and WETH remain largely inactive—indicating that TRON users favor native tokens over wrapped assets.
Swap count data, when paired with technical and price analysis, helps reveal where sentiment is building up. Not all green zones mark tops—but they often reflect moments of opportunity and risk.
Written by BorisVest


