On Thursday (August 7), in the early morning of Asia, Bitcoin hovered below $115,000, rising 1% within 24 hours. It is currently still in a correction phase after a historical high, with thin market trading and lack of confidence. Investors are weighing economic factors and expectations that the Federal Reserve may cut interest rates.
Meanwhile, Ethereum faces selling pressure near the key resistance area around $4,000, with selling pressure reaching $419 million, the second-highest in history. This price level previously triggered a 66% drop at the end of 2024, hence there is currently a 25% to 35% downside risk. Nevertheless, 48% of bettors on the Polymarket platform are still betting that Ethereum will rise to $5,000.
According to Glassnode data, Bitcoin has entered the 'air gap' area, which is the low liquidity zone between $110,000 and $116,000. This area was previously a support zone for short-term holders but has now been lost.
Such areas usually have sparse trading; they either become new accumulation zones or turn into 'trap doors' if demand fails to recover.
Glassnode analysts say: 'The market is seeking a new foothold.' They view the range from $110,000 (the previous historical peak) to $116,000 (the recent buyer cost zone) as a new 'tug-of-war' zone.
Although there are signs of buying on dips - with 120,000 Bitcoins bought during the correction - the price has not yet clearly broken through the resistance level, particularly at $116,900, which is the recent entry cost for short-term holders.
The profit rate of short-term holders has dropped from 100% to 70%. Glassnode considers this a normal phenomenon in the mid-bull market. However, without new capital inflows, market sentiment could deteriorate rapidly. ETF funds saw a net outflow this week, decreasing by 1,500 BTC in a single day, the largest drop since April; at the same time, the funding rate in the derivatives market has decreased, reflecting reduced leverage and a more cautious stance from speculators.
Market maker Enflux's client report holds a similar view: 'Although some altcoins have eased, mainstream coins like BTC and ETH are still struggling to inspire market confidence.' The report notes: 'The overall trend is sluggish, with thin trading volume.'
Ethereum has risen 2% in the last 24 hours and is currently trading below $3,600. The CoinDesk 20 index has risen 1.69% to 3,815.22 points.
Enflux added: 'Unless BTC and ETH can strengthen with trading volume, the market may still maintain a volatile or downward trend.'
The key to the upcoming trend is whether buyers are willing to establish support in the current low trading area, or if the market needs to drop further to around $110,000 for a new round of washing out before resuming the upward trend. Current traders remain generally cautious, with the bulls in the market not forming effective support yet.
Bitcoin's implied volatility has dropped to its lowest point in 2023.
According to data from the trading platform TradingView, Bitcoin's 30-day implied volatility (measured by Volmex's BVIV index) fell to an annualized 36.5% on Wednesday evening, marking the lowest level since October 2023. At that time, Bitcoin's trading price was still below $30,000.
This new low over the past year indicates that although US economic data shows signs of stagflation risk, options traders have not rushed to hedge. The demand for options (contracts used to hedge or profit from price fluctuations) is a key factor driving the implied volatility of assets.
The same phenomenon has appeared in the stock market, where the volatility index VIX of the S&P 500 surged from 17 to 21 on Friday and has recently retreated. VIX reflects the implied volatility of the S&P 500 index over the last 30 days.
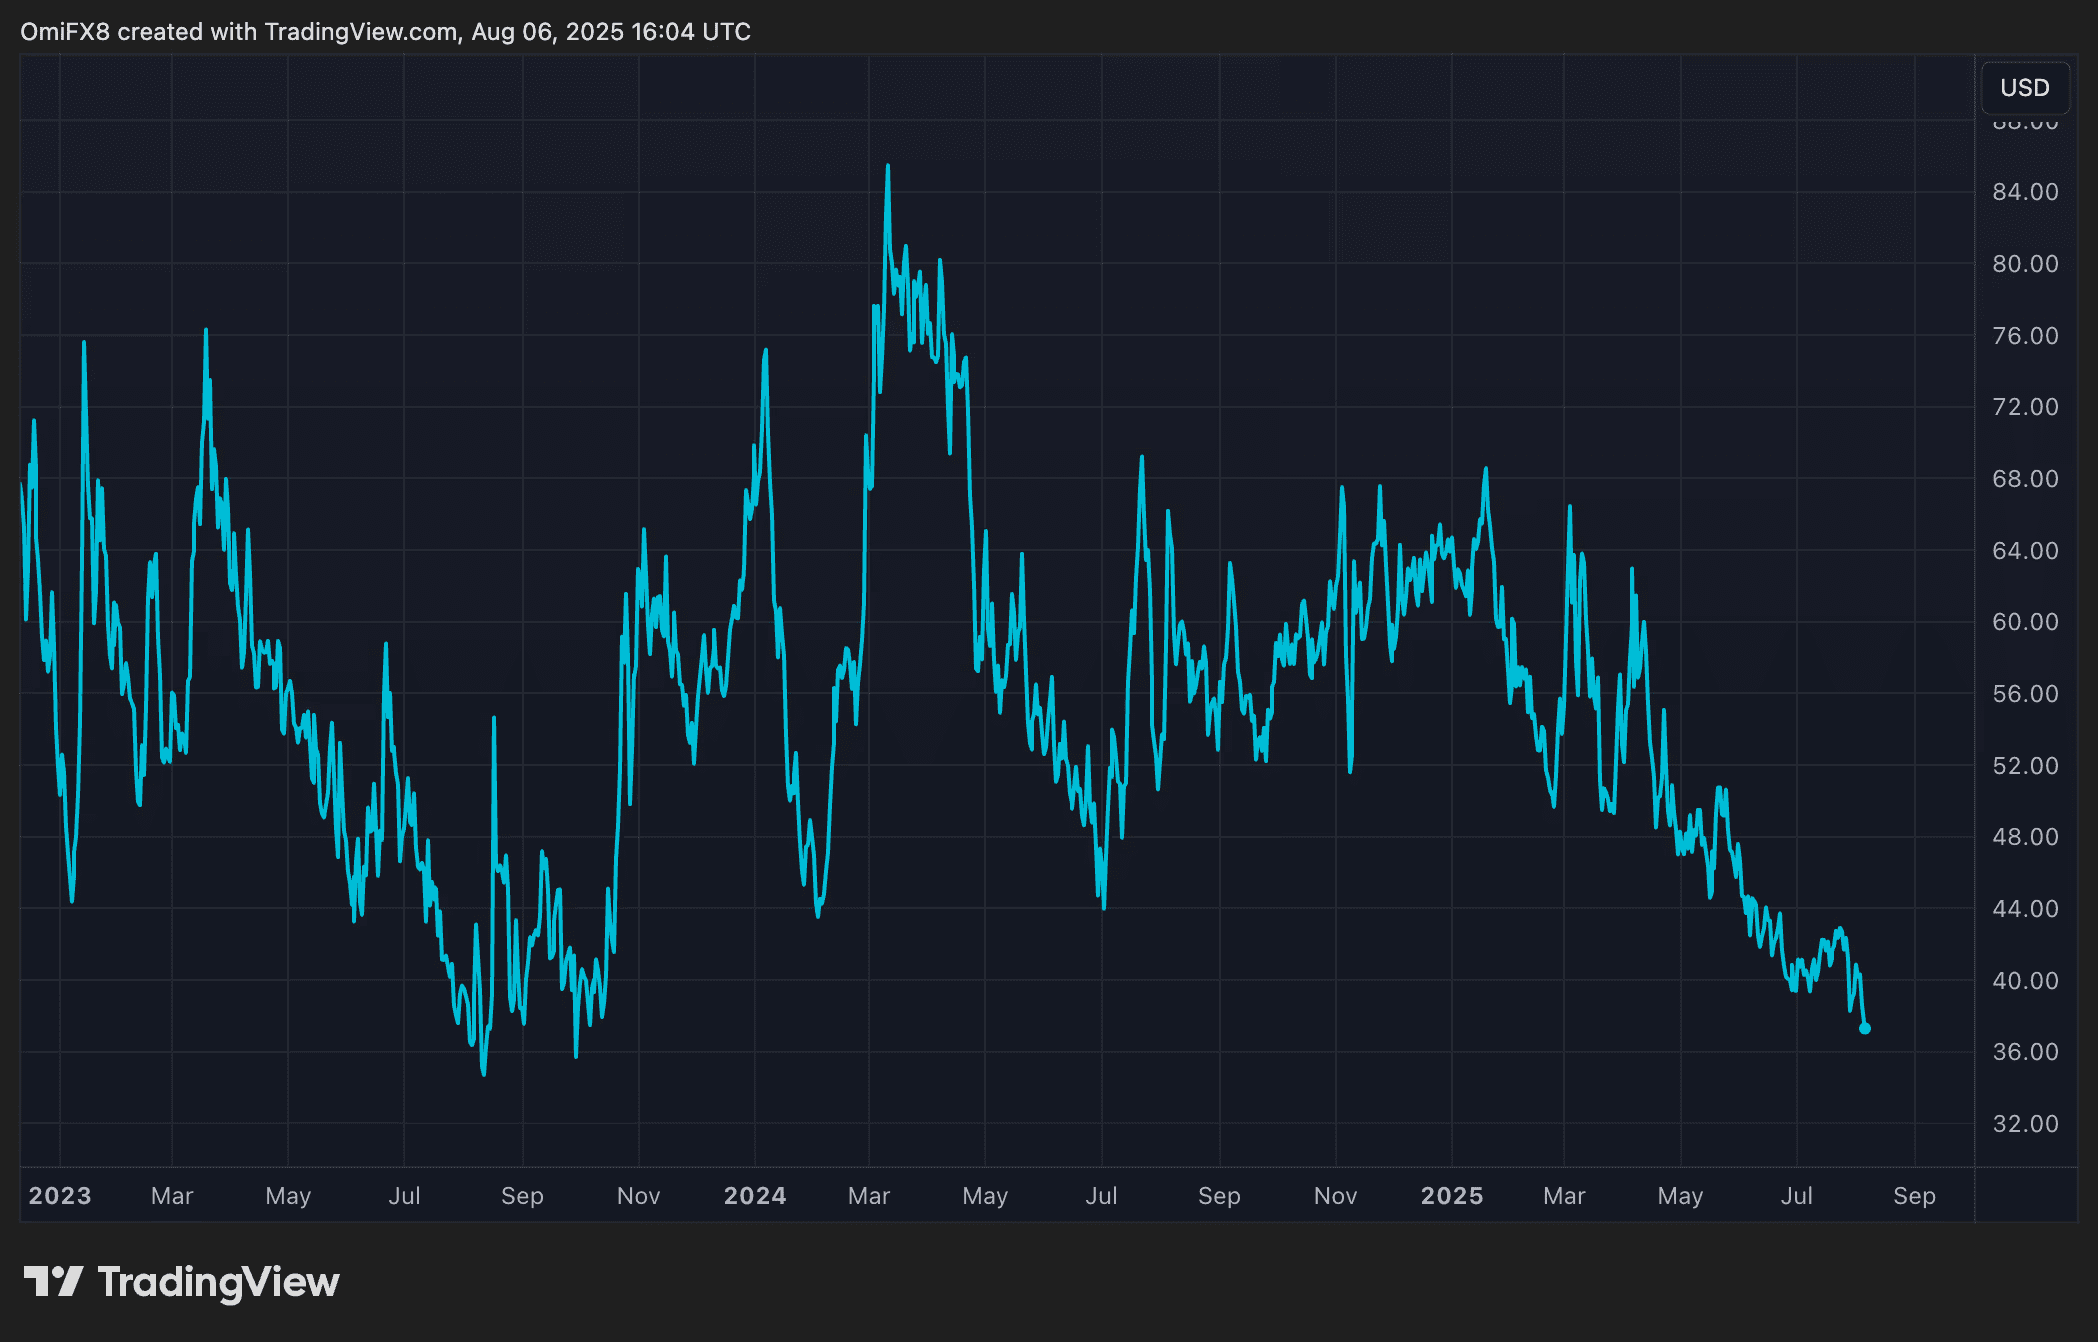
Bitcoin's implied volatility has been declining for several months, inversely correlated with its spot price - since November 2023, BTC price has risen from $70,000 to over $110,000. This negative correlation indicates a significant shift in Bitcoin market dynamics. Historically, Bitcoin's volatility has typically been positively correlated with its spot price, whether in bull or bear markets, volatility tends to rise.
Analysts told CoinDesk that this newly emerging divergence between spot price and volatility is partly due to the increasing popularity of structured financial products, especially those involving selling out-of-the-money call options.
This new trend indicates that Bitcoin is increasingly replicating Wall Street's operating model - where implied volatility tends to decline during a stable upward trend.
Bitcoin Technical Analysis
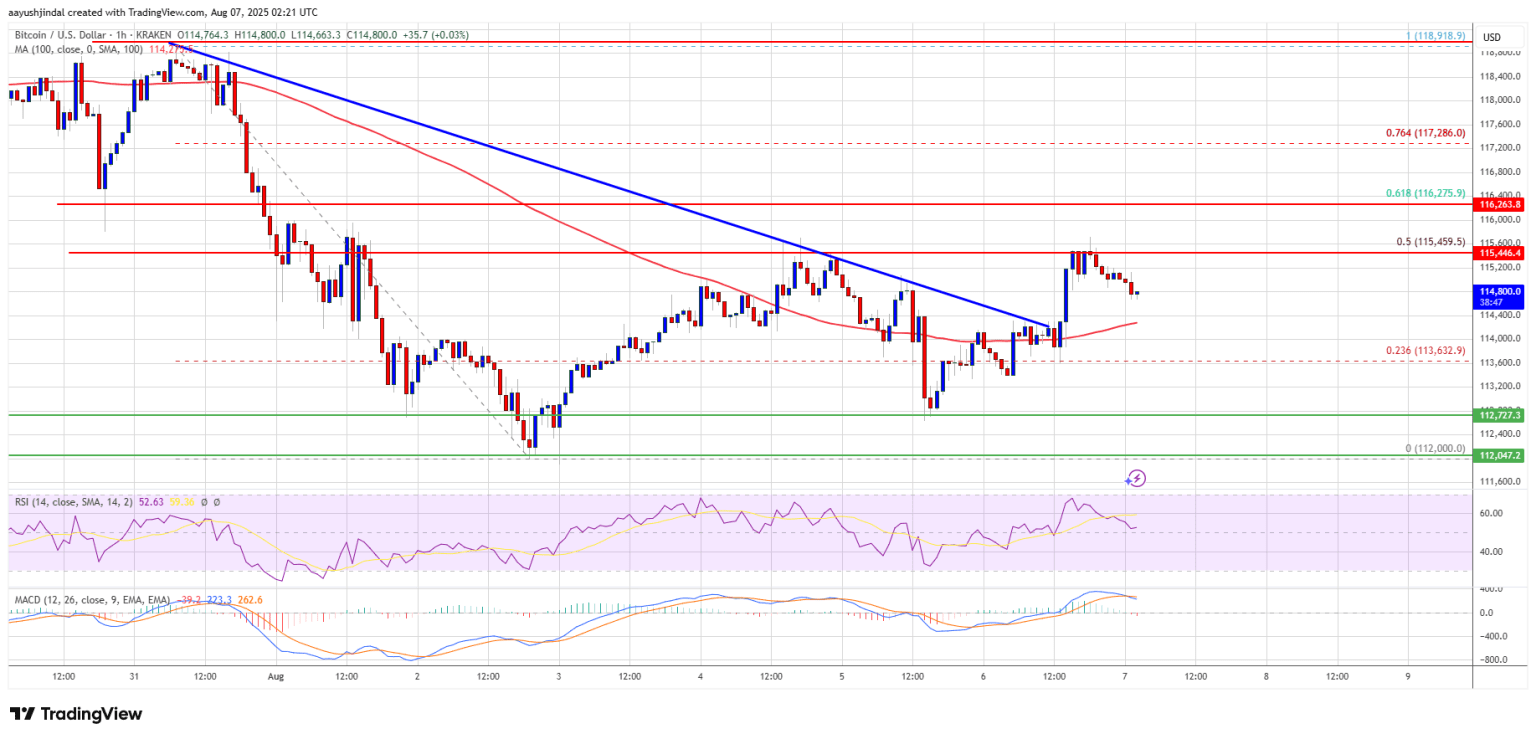
The price of Bitcoin is attempting to rally again, currently trading in the $114,200 area. BTC is in a consolidation phase and may attempt to break through the resistance level of $115,500.
Bitcoin has found support around $112,000 and is beginning to rebound. BTC has successfully broken through two resistance levels at $113,500 and $114,200. Additionally, on the BTC/USD hourly chart, the price has broken the descending trendline resistance located around $114,300. This wave of increase brings the price close to the 50% Fibonacci retracement level from the peak of $118,918 to the low of $112,000.
However, near the resistance level of $115,500, bears are gaining strength again, and the price of Bitcoin has failed to continue rising. Currently, the price of Bitcoin is maintaining above $114,000 and is operating above the 100-hour simple moving average.
In the short term, the immediate resistance level above is around $115,000. The first key resistance level is at $115,500, with further resistance at $116,250, which is also the 61.8% retracement level from the high of $118,918 to the low of $112,000. If the price successfully closes above the resistance level of $116,250, Bitcoin may rise further. In that case, the price may test the resistance level of $117,500. If it continues to rise, the target may increase to $118,000, with the main target being $120,000.
If Bitcoin fails to break through the resistance area of $115,500, a new round of decline may begin. The first immediate support level below is at $114,200, with the next major support level at $113,500. If it breaks below $113,500, the next support is at $112,000. Further declines may push the price towards the $110,500 support level, with key support around $108,500; if this level is lost, BTC may continue to fall.
Technical Indicators:
Hourly MACD: The MACD indicator is showing weakening momentum in the bearish zone.
Hourly RSI: The RSI for BTC/USD is currently above 50.
Main support levels: $113,500, followed by $112,000.
Major resistance levels: $115,500, followed by $117,500.

