Do not view stability as some kind of supreme myth. I have immersed myself in the trading field for ten years, dedicated full-time for six years, enjoying a carefree lifestyle, almost insulated from stress. The stability-derived gains are far beyond what an ordinary office worker can reach, but to be pragmatic, it also has its limits, far from the infinite wealth some people fantasize about.
After six years of ups and downs, I gradually explored a trading path suitable for myself under the guidance of a wise person. Although I can't say I've joined the ranks of the wealthy, stable profits are already in my pocket, allowing me to easily surpass over 90% of my peers.
Long ago, I realized the tremendous support an excellent trading system can provide for investors. At the same time, I also know that blind trading without systematic guidance is akin to repeatedly losing in a gambling arena. However, building an effective trading system is no simple task. A truly excellent trading system often goes against human nature; it requires you to discard greed and fear, remain calm and decisive, reject subjective assumptions, and strictly execute the set strategy.

Welcome to my knowledge-sharing series! The purpose of this series is to guide everyone step by step in learning and judging various situations in the market.
The outline of knowledge sharing can be summarized as: starting from the bottom indicator area, then leading everyone to understand candlestick charts in the price trend area, interspersing macro concepts such as Dow Theory, Elliott Wave Theory, etc.
Looking at the entire analysis chart, it is mainly divided into price trend area and indicator area. We will gradually build a solid foundation, and the main content of the first lesson is the MACD indicator.
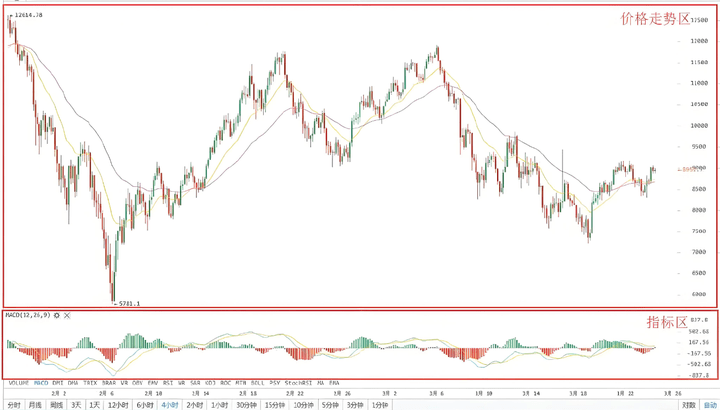
The MACD indicator, also known as the Exponential Moving Average Convergence Divergence, is developed from the Double Exponential Moving Average. Simply put, it represents the convergence and divergence between the short-term and long-term moving averages, indicating the current bullish or bearish state and the potential trend changes of stock prices through the dispersion and aggregation of short-term and long-term moving averages. It is easier to read, and we often mention MACD in Xiaofang's essays.
MACD consists of the blue line DIF, yellow line DEA, and histogram. The zero line is the central axis; above zero indicates strength, while below zero indicates weakness. When the blue line crosses above the yellow line, it's a golden cross; when the blue line crosses below the yellow line, it's a death cross.
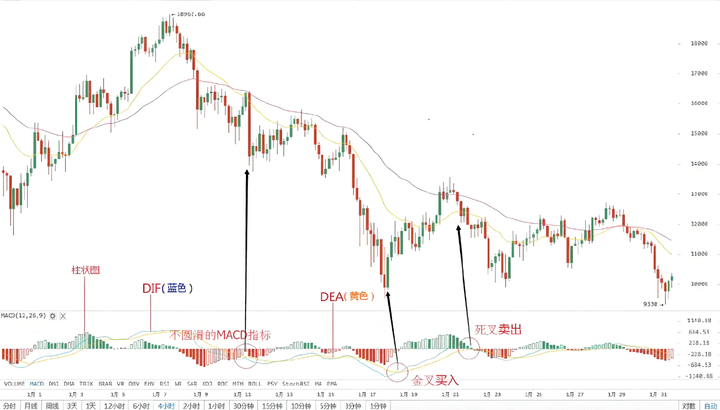
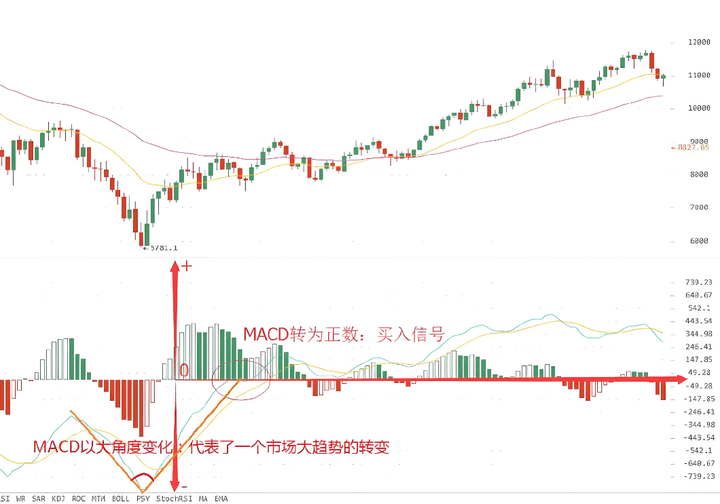
1. In theoretical knowledge, when the MACD turns from negative to positive, it signals a buy. When it turns from positive to negative, it signals a sell. A significant angle change in the MACD indicates that the gap between the two moving averages is widening rapidly, representing a major trend change in the market.
In practical operation, MACD has two main functions: one is to determine trends, and the other is to judge pullbacks or reversals through divergences.
1. Buy on golden crosses, sell on death crosses.
Simply put, it's about chasing highs and cutting losses. In a bullish market, buy on golden crosses; in a bearish market, sell on death crosses. However, in practice, it's often necessary to anticipate these signals, but the market makers won't make it easy for you to analyze the trends. You need to combine other indicators for further action.
2. Sell during top divergence, buy during bottom divergence.
Generally, the MACD indicator should move with stock prices. However, due to certain factors, it sometimes fails to synchronize with prices, which is the divergence that many often see. Simply put, divergence occurs when price and indicator exhibit different trends.
Mainly divided into two types:
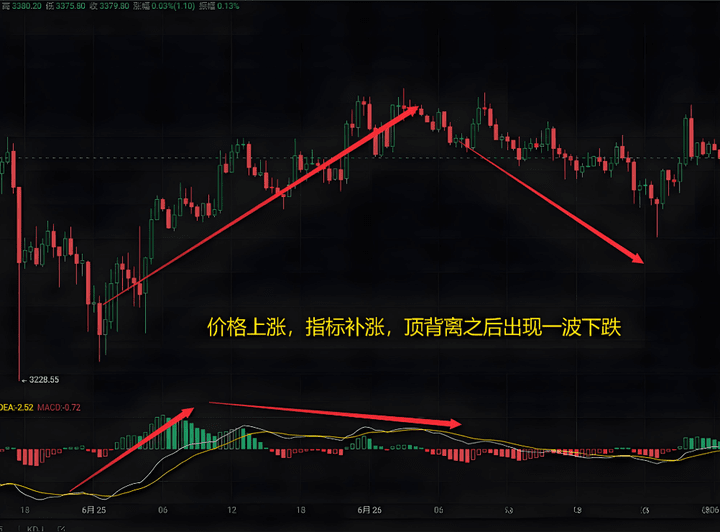
(1) Top divergence: prices reach new highs while the MACD indicator declines.
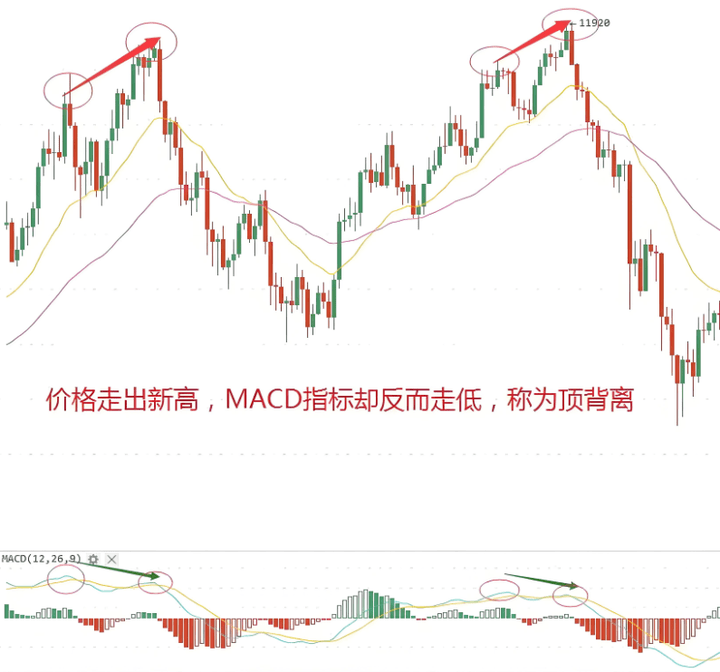
(2) Bottom divergence: prices fall while the MACD indicator rises.
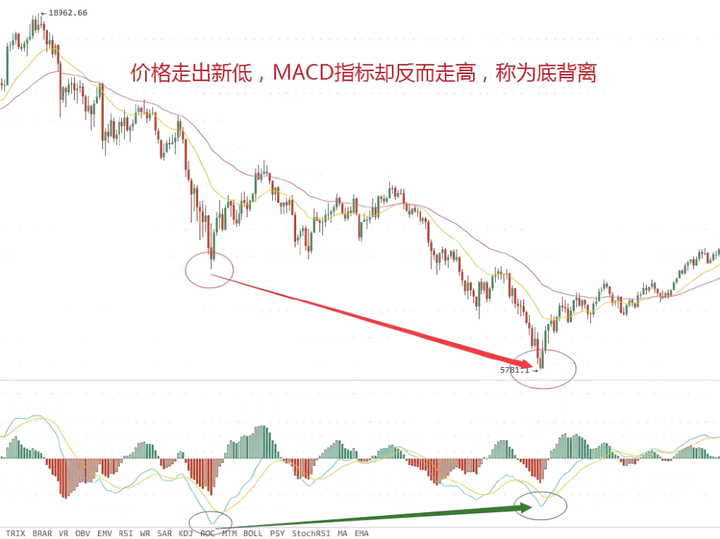
In practice, it is often summarized as 'escaping the top' and 'buying the bottom.' When there is top divergence, sell; when there is bottom divergence, buy. During a rising trend, prices continuously reach new highs, and the moving averages are in perfect bullish arrangement. If only looking at prices and moving averages, it seems the bullish trend hasn't ended. However, after several waves, the market seems to have changed. The top divergence in MACD often reminds everyone that this trend may end at any time.
MACD is a commonly used technical indicator; essentially, any financial product's trading interface will feature MACD as the first sub-chart. The fact that so many people use it indicates its usefulness. Additionally, the more people use it, the more feedback it generates in the market. When everyone sees this signal, their actions based on it will create feedback in the market, causing the signal to truly drive market movements. Therefore, regardless of whether you are a technical trader or not, you must have a detailed understanding of MACD.
Everyone can find the basic uses of MACD, so I won't elaborate here. However, many realize that those textbook teachings seem like truths, but they don't make money when applied. This is because the authors of such books were eliminated by the market; they write books after failing to make money in the market. Here, I will share some real practical usages.
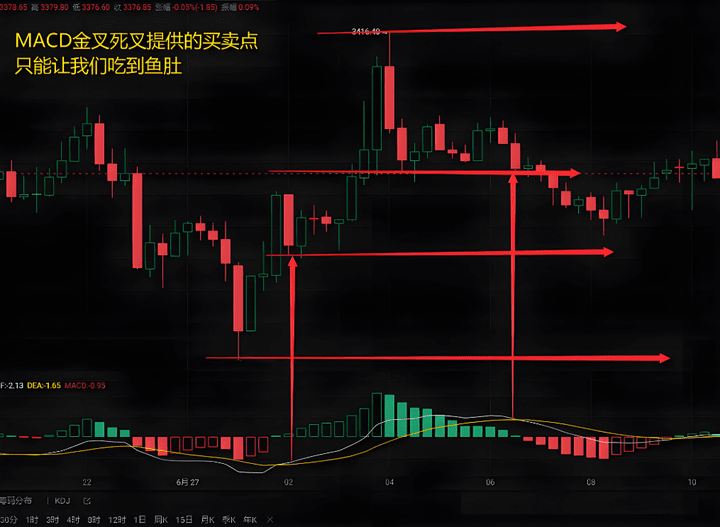
The advantages and disadvantages of MACD.
To understand an indicator, one must first know its advantages and disadvantages, when it should not be used, when it is not useful, when it is ineffective, and when it is best used. MACD is a trend indicator; its advantage is a very high accuracy rate, but its disadvantage is also very obvious: it is severely lagging. With high accuracy, we can use it as a trend indicator, and its accuracy is higher over longer periods, only making mistakes during market transitions. The severe lagging drawback means it is very difficult to find perfect buy and sell points using this indicator. If using MACD to find buy and sell points, it is important to be clear that we only catch the belly of the fish, or even just a part of the belly, and only by clarifying this can we use MACD to find buy and sell points.
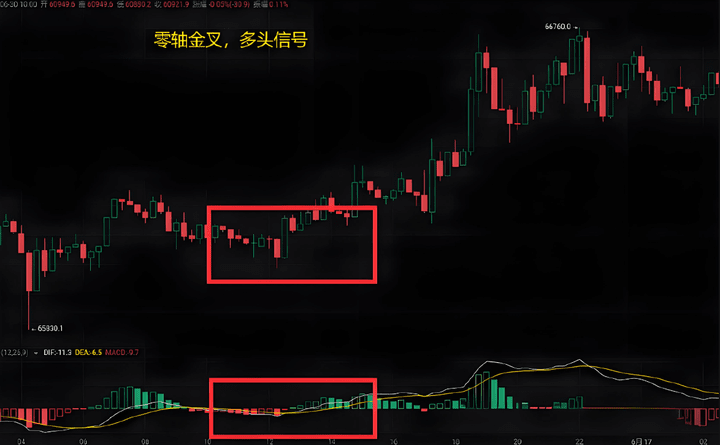
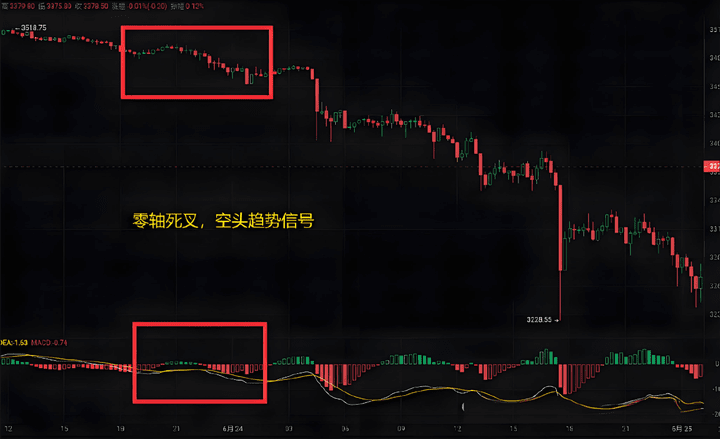
Zero axis.
The zero axis of MACD can be considered as the boundary between bulls and bears. Below the zero axis, it's a bearish trend, and bulls should avoid entering; even if entering, it should be with a light position, and exit quickly. Bullish signals can hold based on trend. The opposite applies above the zero axis. The golden and death cross signals formed near the zero axis are referred to as zero axis golden crosses and death crosses, which are more effective bullish and bearish signals.
Divergence.
Divergence is a practical pattern of MACD. Normally, price and indicator move in proportion. When price and indicator consistently move in opposite directions, it signifies divergence. This abnormality must have a cause; if prices rise but the indicator falls, it indicates that the rise is problematic, and the same applies to bottom divergence.
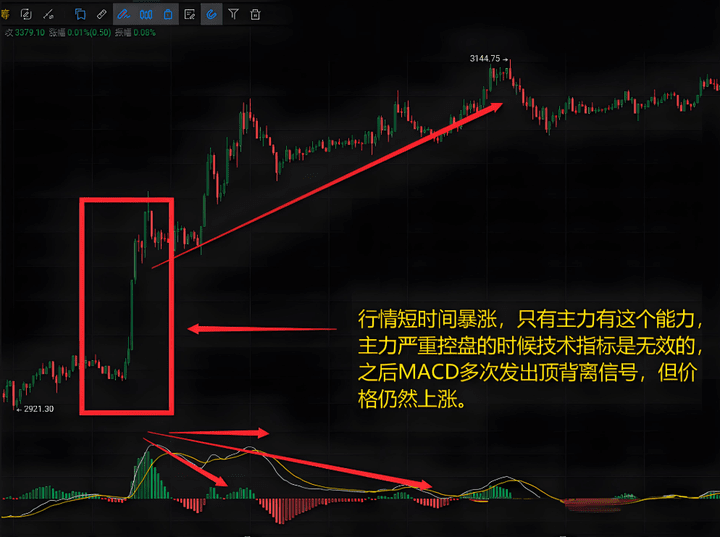
It should be pointed out that the crypto world occasionally experiences low-probability one-sided markets, during which divergences become ineffective. This can be easily eliminated by observing the intensity; when the upward or downward force is extremely strong, such rapid movements indicate market manipulation. At such times, technical indicators become ineffective, and divergences will continue regardless of their accuracy.
Technical indicators are tools for observing the market. Since everyone is looking at them, it shows they are useful. Even if they are not useful, because investors are looking at them, they can become useful, as the market itself is determined by the actions of countless investors. However, everyone should be aware that many times technical indicators are ineffective or not useful. Every technical indicator has its drawbacks, and the more useful the indicator, the more obvious its shortcomings. Learning to use a technical indicator requires first understanding its weaknesses and leveraging its strengths to bring us stable returns.
In summary, the MACD indicator has considerable functionality, but due to the intentional manipulations affecting price movements, novices are often misled. Once again, we need to combine other indicators for further actions. To discuss further, we need to take a macro perspective; we must not focus solely on a single indicator—this point must be engraved in your heart.
Finally, let me share 11 bloody lessons from the crypto world! What you see is the realization!
1. Not acting during sideways movement is winning.
If the market stays sideways for more than 5 days, with neither bulls nor bears winning, guessing is just giving away money. In 2018, BTC was sideways for 8 days; I bet 100,000, and on the 9th day, it plummeted, losing 70,000—waiting is worth 10 times more than acting.
2. Hot coins must be exited within 3 days.
Hot coins rise quickly and cool down even faster. I chased a popular coin, made 20% on the first day, got greedy, and on the third day, the project team dumped it, losing 80% overnight. Rule: when the group shouts 'get rich,' reduce your position; if someone curses, clear your position.
3. In a strong trend, dare to hold.
In 2021, ETH gapped open 100 dollars; the group said 'inducing more buyers,' but the volume broke the previous high + the 20-day moving average was turning up, indicating a main rising wave signal. I held on despite the anxiety and ultimately made 800,000—don't let 'fear of heights' scare you out.
4. Take profits on large bullish candles first.
A large bullish candle at a high price = the main force calling for buyers. When BTC surged to 48,000, the trading volume was three times that of the previous day; I reduced my position by 60%, preserving profits during the pullback. In the face of a large bullish candle, take profits on half first.
5. The 20-day moving average is a safety belt.
Buy on the way down, sell on the rebound. The 20-day moving average is the market's cost line: most people make money above it, and the trend is upward; most people lose money below it, and the trend is downward. Follow the trend and don't get beaten by the big trend.
6. The three no rules: don't sell during a surge, don't buy during a dive, and don't act during sideways movement.
A few years ago, I would change coins three times a day and pay thousands in fees; it’s better to stay still. Buying low and selling high means waiting for signals, not blindly fidgeting, which can filter out 80% of ineffective trades.
7. Always diversify, with a maximum of 10% position.
I've stepped into the pit of losing 50% on all altcoins. Even if I’m 100% confident, I will invest a maximum of 10%. Keeping cash means having ammunition; someone who puts all in can win 9 times but lose once and go back to zero.
8. Look at the capital movement for positive and negative news.
Coins that have received 'major investment' and drop on positive news = false positives; hurry to run. Regulatory negatives, BTC drops 5% and rebounds = genuine resilience; can increase positions. The market is more honest than the news.
9. There should not be too many indicators; three is enough.
Use MACD to look at trends (golden crosses and death crosses), Bollinger Bands to gauge sentiment (upper band indicates overbought, lower band indicates oversold), and volume to distinguish authenticity (only true increases in volume indicate real moves). Success rates are high when all three signals align.
10. Write a plan for every trade.
Before buying, write down clearly: what to buy, position size, stop loss, and take profit. In the past, I would buy based on instinct, not knowing when to sell when prices rose, and unwilling to cut losses when prices fell. Writing a plan can help curb impulse, and even losses will be understood.
11. Stop losses and take profits are lifelines.
If a single coin drops more than 3% (up to 5%), cut it. If it rises to the target, sell half first. During the bear market in 2022, I used a 3% stop loss, controlling losses to 15%; this year in the bull market, I preserved profits by 'selling half.' Surviving is the key to making big money.
To be honest, during my toughest times, I had only 30,000 left. It's not about being smart; it's about understanding that 'discipline is key in the crypto world.' Now, I don't stay up late, don't overtrade, I take walks with my child, and bring home 100,000 for living expenses each month, while my account is still growing.
If you follow these rules, you can earn steadily.
These 11 trading logics are core experiences refined from practical losses, centered around 'discipline, rationality, and risk control.'
During sideways movements, refrain from making trades; do not guess the direction.
Take profits on popular coins; don't get attached.
When trends strengthen, hold firmly without being disturbed by short-term fluctuations.
Take profits on large bullish candles to avoid the risk of being led on.
Use moving averages as trend anchors, do not operate against the trend.
Follow the principle of 'don't sell during a surge, don't buy during a dive, and don't act during sideways movement,' filtering out ineffective trades.
Always diversify your portfolio and keep enough cash on hand to seize opportunities.
Don't let news headlines sway you; closely monitor the real reactions of market capital.
Simplify indicators and focus on signal resonance.
Write a plan for every trade in advance, defining buy and sell points, position sizes, and stop losses and take profits.
Consider stop losses and take profits as a lifeline, using strict rules to protect principal and secure profits.
Ultimately, making a profit in the crypto world does not rely on luck but on using rules to suppress greed and controlling risks with rhythm. Maintaining discipline is essential for long-term survival and steady profits in bull and bear markets.
No matter how diligent a fisherman is, he won't go out to fish in stormy weather; instead, he will carefully protect his boat. This season will pass, and the sunny days will eventually come! Follow Yan An, who will teach you to fish and fishery. The doors of the crypto world are always open, and only by going with the trend can one have a life that aligns with the trend. Save this knowledge and keep it in mind!

