Let me talk about myself! After losing 800,000, I slowly crawled back with 2000 USDT! Now I trade cryptocurrencies to support my family, with over 40 million in my account!

In that bear market, I lost a full 800,000. I held on during the day, but collapsed completely at night. I cleared my Moments, my contacts were silent, no one understood, and I was left spinning in place.
During that time, I really wanted to give up; I felt the crypto world was too far from me.
Until one night, I came across a saying: 'Loss is just the beginning; chaos is the end.'
At that moment, I felt like I was awakened.
I took my last 2000 USDT as my final chip, not to gamble, but to completely rebuild.
I began to review and summarize each trade one by one, and only then did I see clearly: losing money is not due to bad luck, but because I was not 'trading' at all.
Do not set stop losses, heavily invest all in, chase highs and cut losses, frequently switch coins, and rely on emotions!
To put it simply, I am not making strategies; I am guessing sizes.
This time, I only did two things: maintain the pace and execute strictly.
We all like trends.
Trends represent the continuation of the market and ongoing profit opportunities. However, consolidation is the norm in trading.
Trends are nothing more than prices continuously rising or falling; once the price stops rising or falling, the trend is likely to end. However, consolidation is quite different:
It could be due to a lack of volume, it could be encountering a price wall, or it could be accumulating strength.
Tops and bottoms can occur, and so can market continuations.
There may be false breakouts, which can lead to both bullish and bearish traps.
Of course, more importantly, the end of consolidation often represents the beginning of a trend. Therefore, recognizing consolidation is as important as seizing a trend. Today, we will discuss consolidation.
1. Three types of consolidation: high, low, and middle.
High and low consolidations occur at the top or bottom of the market, and there are three forms in total:
The first type is non-absorption type consolidation.
Although there are active buy orders, there are no matching sell orders, so the price remains within a certain range.
You can understand this principle from the mechanism of price formation. The formation of a price must correspond to a buy order and a sell order. If there are only buy orders without sell orders, or only sell orders without buy orders, the price cannot form.
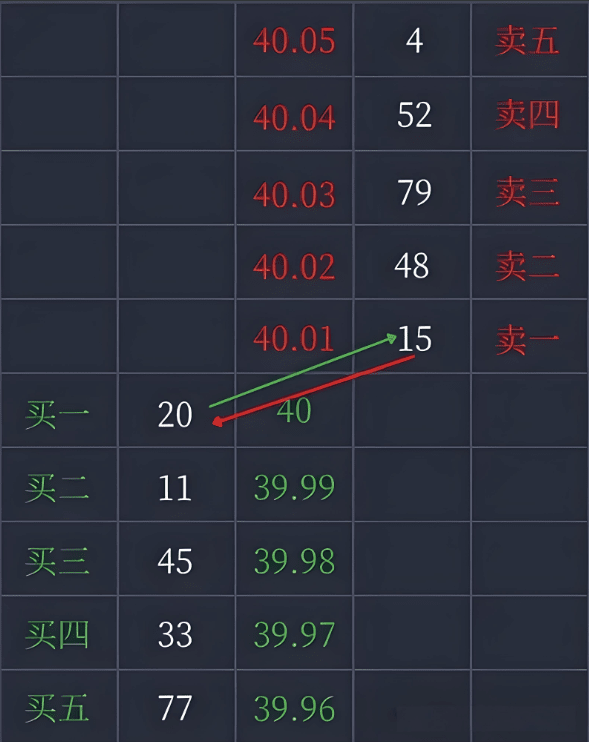
Non-absorption type consolidation generally has smaller trading volumes because there are no transactions. But once a breakout occurs with increased volume, it indicates that the market has reached a consensus, and it is basically a trend.
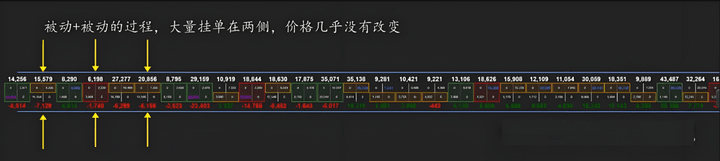
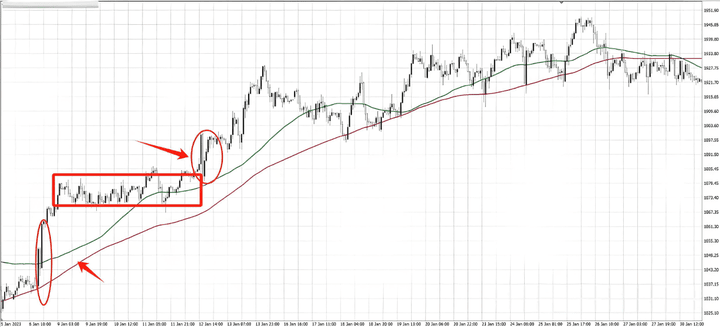
If there are no order flow tools, you mainly look at candlesticks. If there is a rapid rise followed by a narrow range of fluctuations, and the candlestick bodies are very short, it indicates that the market is choosing a direction. Once a breakout occurs, it becomes a trend.
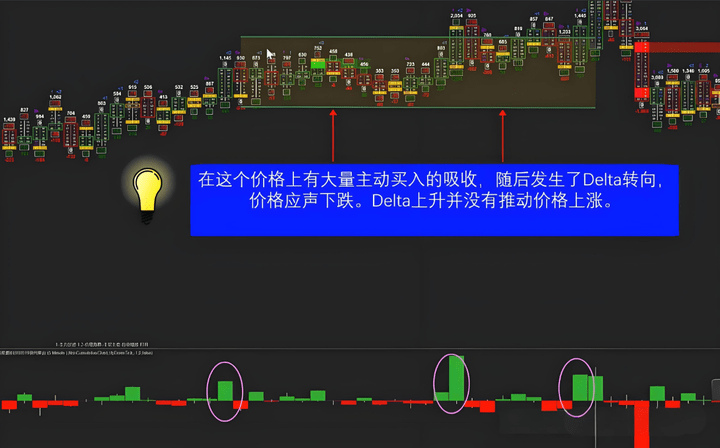
The second type is absorption-type consolidation.
How to understand absorption: no matter how many orders you buy, if there are continuous orders above, you will never be able to buy them all, just like your orders are being absorbed.
In simpler terms, this is what is called a price wall.
There are many reasons for the formation of price walls:
① One is that the opposing party has the operator entering the market, preventing the current price trend from continuing, thus placing a large number of orders;
② There are also iceberg orders; large institutions split their orders into many small parts, placing part of the order at one price, so it seems like you are constantly pushing the price, but in fact, you cannot buy all the orders above, and instead, you push the price to where the operator wants it.
In any case, you will find that although trading volume has increased, the price cannot rise, indicating that institutions have sealed off orders at the top. Once your chips are exhausted or you give up on continuing to push, a price drop is not far away.
In order flow tools, there is a specific indicator called Delta, which is the number of net long orders minus net short orders. If the number of net long orders increases, it indicates that the bulls are making an effort. If the price has not risen at this time, you should realize that there are sealed orders above.
Once the Delta shows a net increase in short orders, it indicates that market sentiment has changed, and the bulls' efforts have failed.
The third type is accumulation consolidation.
Using order flow tools, you will find that the Delta here is not like an absorption-type consolidation; net long and net short orders alternate, with no clear indication of which side is stronger, but you will see that trading volume is continuously increasing.
This indicates that the bulls and bears are evenly matched, but the bulls effectively resisted the price decline, suggesting that a bottom may form here.
Order flow tools on the market have introduced a third indicator called imbalance. Imbalance refers to a situation where, in a single candlestick, the number of long orders/short orders >3, or short orders/long orders >3, which are called bullish imbalance and bearish imbalance, respectively, representing the dominance of bulls or bears.
If an imbalance occurs three times in a row, it is called an accumulation of imbalance, indicating that one side has the continuous power to drive the market.
You can understand this: originally, both buyers and sellers were evenly matched, but if one side becomes imbalanced, it indicates that there are more chips on hand, and naturally, the scale of victory will tip in their favor.
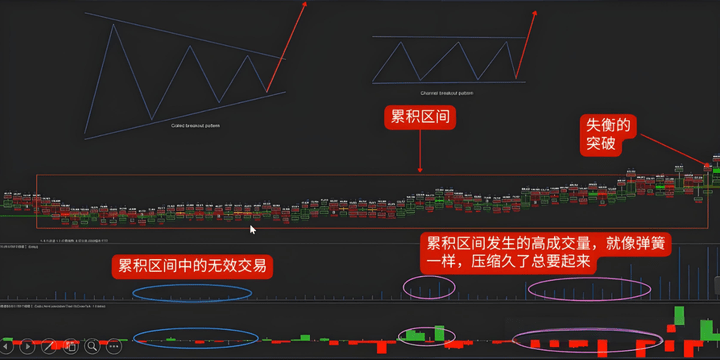
Therefore, when there is a continuous increase in trading volume, and imbalances or even accumulating imbalances occur at the breakout zone, it is highly likely that a breakout trend will occur.
2. False breakouts during consolidation.
Of course, besides identifying which types of consolidation there are, the more difficult thing to recognize during consolidation is the false breakout.
I mentioned from the beginning that after consolidation comes a trend, but when the trend will emerge is unknown. Therefore, the operator only needs to create a false breakout at a certain price level to attract following orders.
This is naturally beneficial for the operator; if it is a consolidation before an upward trend, this can lower the average price and increase overall profit. But for following orders, it’s not a good thing. If the trend comes out, it means you are stuck in a position.
Thus, recognizing false signals during consolidation is very important. This is also the essence of the Wyckoff trading method.
Taking bottom consolidation as an example, the Wyckoff trading method refers to it as accumulation, where the bulls begin to collect chips before pushing the price up. It is divided into five stages.
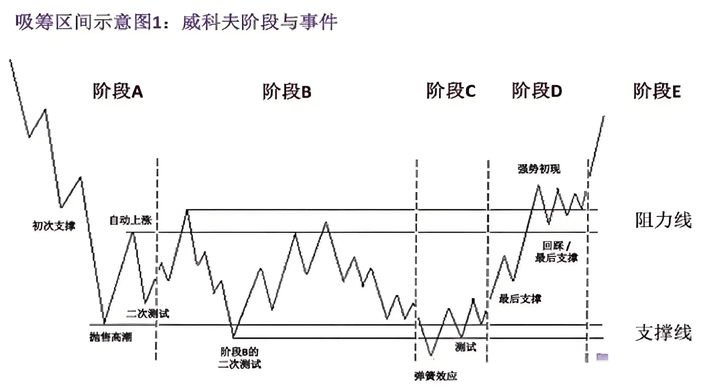
In Stage A, the operator will rapidly push up after hitting the bottom, collecting low-position chips while creating an illusion of an upward movement, but then sells at a high point, causing many following orders to panic sell, giving the operator a second buying opportunity, pushing the price to new highs.
We previously mentioned that continuously rising highs and lows are signs of a normal upward trend, so many people believe this gives a second buying opportunity, but unexpectedly, they faced another sell-off.
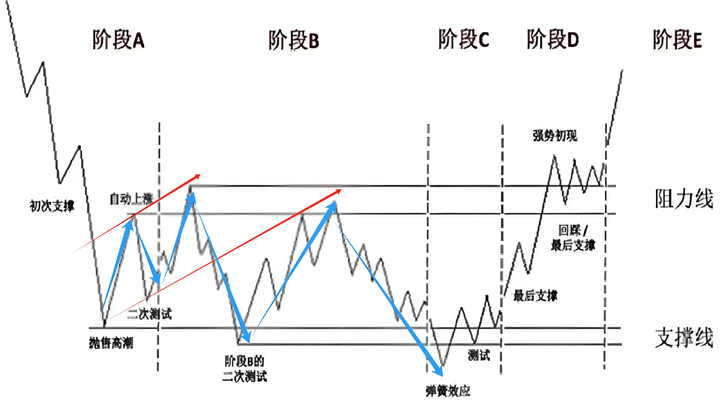
From a technical analysis perspective, a rise followed by a drop that creates a new low is undoubtedly a bearish trend, but this is precisely the last darkness before dawn.
The Wyckoff trading method explains the techniques that institutions use during the consolidation phase and provides more precise tools for range identification.
For instance, the range of accumulation is usually determined by the price during the peak of sell-offs and the automatic rise. Using order flow tools, we only need to find the range with the highest trading volume from the combined distribution, which can quickly determine the value area.
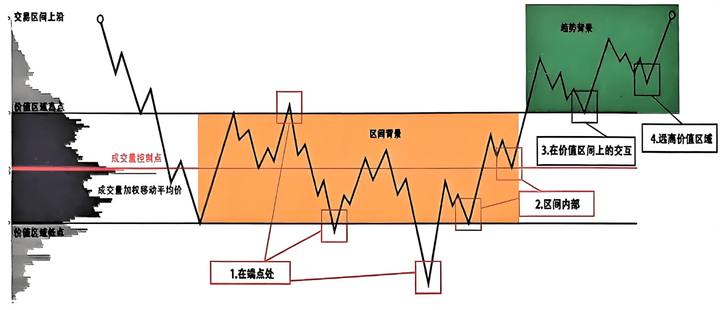
The control point of trading volume is the price level with the largest volume; through introduction, we can pre-lock the position of the last support to decide whether to add to the position in anticipation of an upward trend.
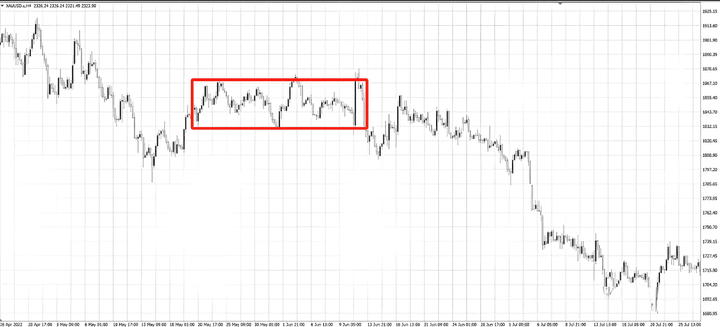
3. Consolidation patterns in the market.
The previous consolidation mainly refers to high and low consolidations, which you can also understand as accumulation and distribution in Wyckoff.
During both upward and downward movements, there are also consolidations; they are usually consolidation patterns. The purpose of consolidation patterns is to clear a part of profit-taking positions and wash out some weak chips, allowing the market to continue better.
The consolidation here differs somewhat from high and low consolidation; it is not a process of accumulating energy but rather a process of buyers and sellers choosing a direction, determining the intermediate trend of the market.
There are generally the following situations:
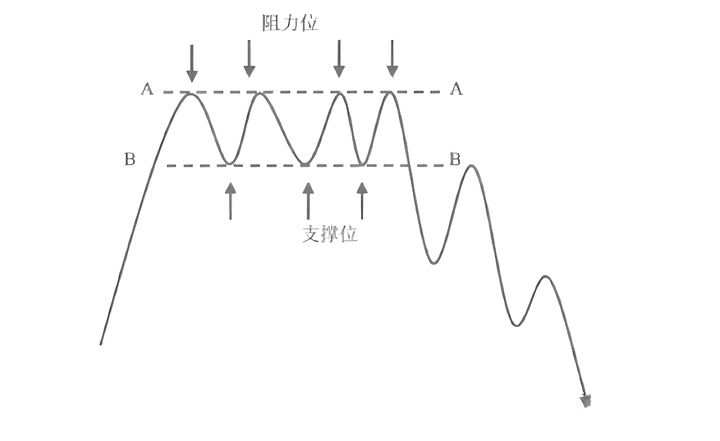
1. Rectangle pattern.
The most common pattern can move both up and down; it mainly depends on whether support or resistance can be confirmed after the breakout.
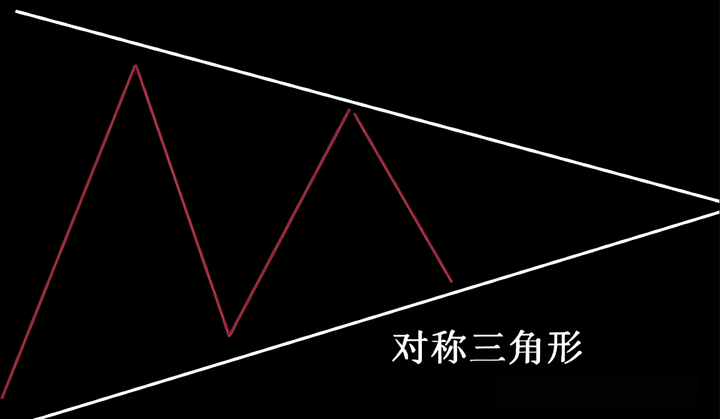
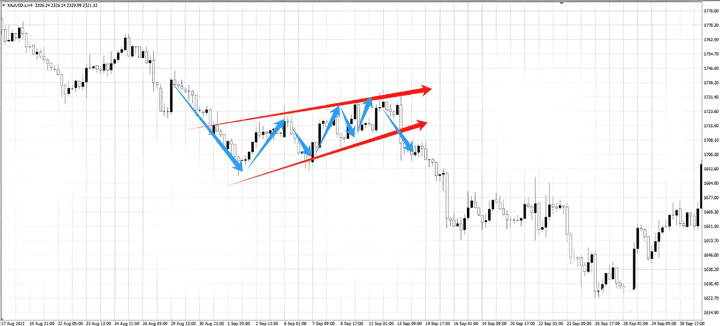
2. Triangle patterns.
Divided into symmetrical triangles, ascending triangles, and descending triangles.
Symmetrical triangles also choose a direction, and both bulls and bears are possible, and they also look at the confirmation of pullbacks after the breakout.
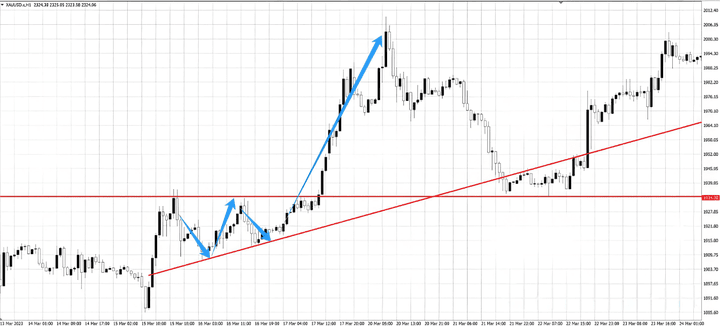
An ascending triangle usually has resistance at the top, but the lows below keep rising, indicating that the bears are unable to push the price lower, while the bulls steadily gain an advantage.
The opposite of the ascending triangle is the descending triangle.
3. Flag pattern.
A descending flag occurs during a rapid decline, where a brief upward consolidation pattern appears, but is subsequently broken down again and accelerates downward. The rapid drop resembles a flagpole, and the upward consolidation looks like a flag, hence the name flag pattern.
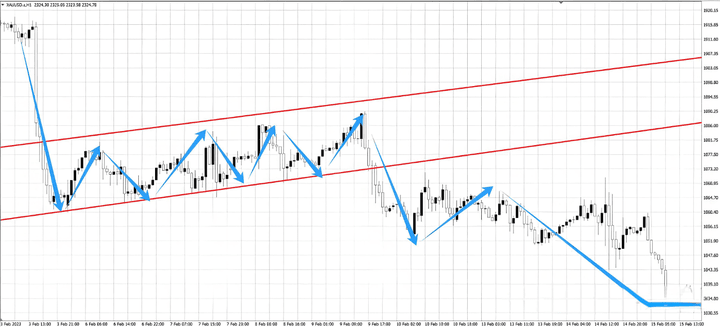
The opposite is the ascending flag.
4. Wedge pattern.
Wedge pattern, similar to the flag pattern but tends toward convergence.
In an ascending wedge, the speed of the top's decline is greater than that of the bottom's, indicating that a bottom is gradually being formed. The selling pressure seems strong, but it hasn't scared off the buyers.
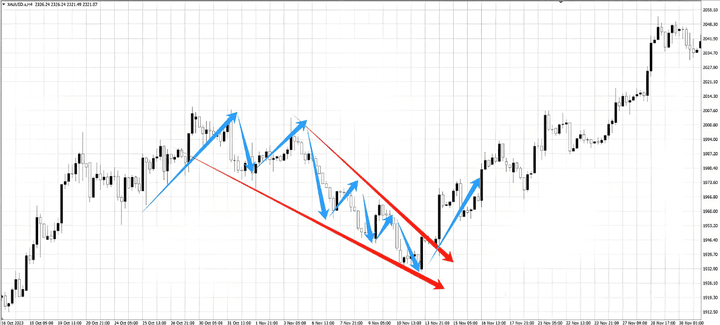
The opposite is the descending wedge.
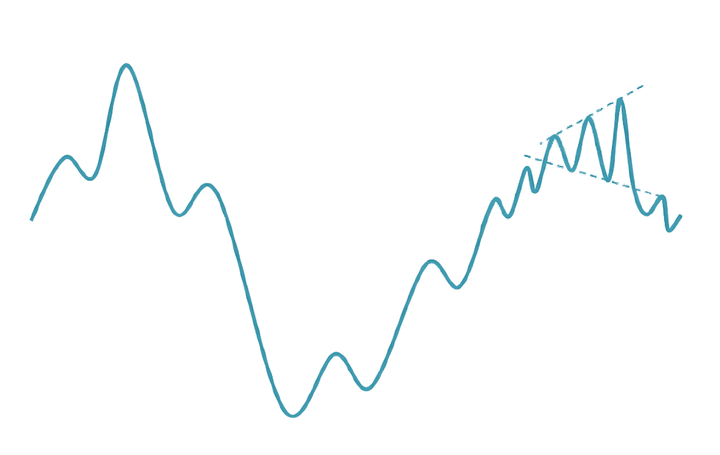
5. Diffusion pattern.
It is generally called a broadening formation, where the highs keep rising and the lows keep falling. This pattern usually has a clear reversal signal.
One is an upward reversal breakout pattern.
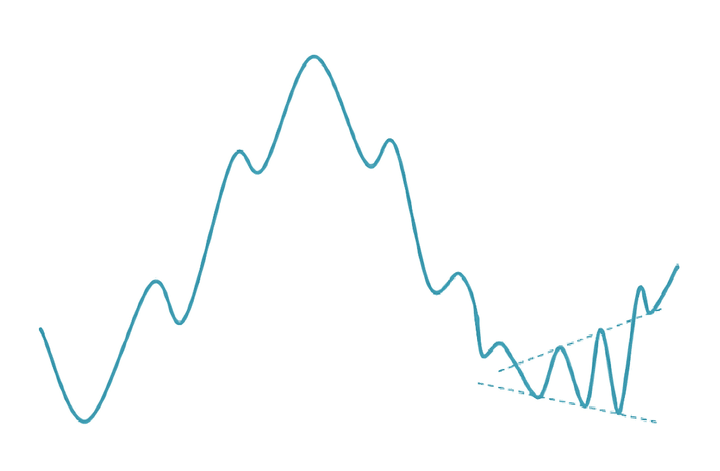
The opposite is a breakout pattern that reverses downward.
The above are the consolidation patterns in the market; through these consolidation signals, it is possible to better identify whether the market is experiencing an intermediate trend or a reversal trend.
However, it is important to note that the situations above are only typical cases. In actual trading, the occurrence of consolidation patterns means the market is choosing a direction, while also being influenced by multiple factors such as fundamentals, liquidity, and technical aspects. Especially fundamental news can easily cause a previously relatively certain trend to reverse, so do not rely too heavily on pattern movements.
In general, consolidation patterns, as a form of adjustment before a trend, represent the market's directional choice. If you can accurately identify the consolidation signals and the stages they are in, then you can seize the complete market movement.
Finally, here’s a summary of the iron rules for trading cryptocurrencies:
1. Don't be impulsive during sideways markets; wait for a breakout before entering.
In a sideways market with fluctuations less than 3% for three consecutive days, I only use 30% of my position to test the waters. When the price breaks through the 20-day moving average, I then increase my position to 50%.
Last year, BTC consolidated around 67,000 for 5 days. I followed suit and made a 15% profit after the breakout. Blindly placing orders during consolidation resulted in my biggest losses.
2. Cut losses immediately when the hot spot surges; do not be greedy.
If the price of a cryptocurrency surges more than 50% in a day, when social platforms are flooded with posts, clear your positions at the opening the next day.
Statistics show that this type of cryptocurrency has an 83% probability of retracing within 72 hours. A certain MEME coin surged two years ago, and I sold it in time, avoiding a 40% drop.
3. Don't rush to run after a gap-up, wait for the overbought zone to sell in batches.
When encountering a gap-up with a trading volume tripling, hold firm and wait for the RSI overbought signal to sell in batches.
I operated like this when Ethereum upgraded, earning 127%. Many people run away after a 10% rise, missing the main upward wave.
4. On the day of a huge bullish candle, you must exit the market.
When single-day trading volume surges more than twice the average of the last 60 days, clear out positions before the end.
In 2023, a certain cryptocurrency had a favorable news release that caused trading volume to surge, and I sold in time to avoid a 38% drop.
5. Use the 55-day moving average as a dividing line; buy on bearish candles and sell on bullish candles.
Buy when small bearish candles appear online (drop <2%), sell when bullish candles appear offline (rise >3%), combined with MACD golden cross, achieving a win rate of up to 68%.
Using this method for ETH for half a year, I achieved a win rate of 72%. Don't operate in reverse; chasing highs and cutting losses is a rookie's big taboo.
6. Don't chase highs or bottom fish; act only when the trend is clear.
Don't rush to sell if it hasn't surged, and don't rush to buy if it hasn't crashed.
Last year during the SOL correction, I entered at a low point when it crashed, with a cost 8% lower than others, and made a 10% profit during the rebound.
7. Buy in batches to lower costs and achieve steady profits.
Initially, do not exceed 20% of your position when entering; add 10% for every 5% decline, and reduce positions by 3% during rebounds.
This pyramid-style accumulation can reduce costs by 15%-20%. Even if you buy high, you can achieve small profits through averaging down.
The secret to making money in the short term is simply to repeat these 7 ironclad rules.
Be patient during sideways markets, decisively take profits during surges, and maintain stable positions when trends come.
Now I look at the market for no more than 1 hour a day; risks are filtered automatically by these rules. What beginners should learn is not complex indicators but this foolproof discipline.
Remember: there are many opportunities in the market; the key is to have the patience to stick to the rules. If you adhere to these 7 ironclad rules, you will find that making money in the short term is not as difficult as you imagined after three months.
Even the most diligent fisherman would not go out to sea during a storm but would carefully guard his boat. This season will pass, and sunny days will come! Pay attention to Yan An, who teaches you both to fish and to fish for a living. The door to the crypto world is always open. Only by going with the trend can you have a life that flows with the trend. Keep it in mind!