
Original Title: Taking Stock of Crypto Exchanges Pursuing an IPO
Original Authors: Tanay Ved, Victor Ramirez, Coin Metrics
Original Translation: AididiaoJP, Foresight News
Key Points:
· With a favorable regulatory environment and a clear interest from investors in exposure to public market crypto assets, Kraken, Gemini, and Bullish are planning to conduct initial public offerings (IPOs).
· Coinbase's IPO in 2021 set a benchmark for the industry. Coinbase's valuation at the time of its public listing was $65 billion, with 96% of its revenue coming from trading fees. Now, subscription and service revenue accounted for 44% in Q2 2025.
· Among the IPO candidate trading platforms, Coinbase still leads with 49% of the spot trading volume. Bullish and Kraken each account for 22% and are rapidly expanding new services.
· Not all reported trading volumes hold equal value. Wash trade analysis reveals inflated activity on some platforms and highlights the need to evaluate the quality and transparency of trading platforms.
Introduction
Throughout the history of the cryptocurrency industry, the U.S. government's attitude has been lukewarm, even hostile, most of the time. However, last week saw a positive change.
The President's Digital Asset Working Group released a 166-page report outlining the state of digital assets and proposing policy recommendations for establishing a comprehensive market structure. Meanwhile, SEC Chair Paul Atkins announced a 'crypto project' plan in a public speech aimed at making the U.S. the 'global crypto capital' by bringing financial markets on-chain, simplifying the cumbersome licensing regime for cryptocurrency businesses, and supporting the creation of financial 'super apps' that provide a variety of services.
The main beneficiaries of this new regulatory framework are centralized trading platforms. Several private centralized trading platforms such as Kraken, Bullish, and Gemini are leveraging this relatively favorable environment to seek initial public offerings (IPOs). As these companies open up investment to the public, investors need to understand the fundamental drivers behind them. In this article, we will delve into key metrics of these trading platforms and point out some considerations when using reported data from trading platforms.
IPO Boom of Cryptocurrency Trading Platforms
Since Coinbase's IPO in April 2021, there have been very few relevant IPOs in the cryptocurrency industry over the past four years, primarily due to the adversarial relationship between cryptocurrency companies and the former SEC. As a result, private companies have been unable to obtain liquidity from the public market, and non-qualified investors have not been able to profit from investing in these companies. With the Trump administration's promise to introduce a more friendly regulatory regime, a wave of new private cryptocurrency companies has announced plans to go public.
This environment, combined with renewed investor interest in public market crypto exposure, has spawned some of the most explosive IPOs, such as Circle's recent public IPO. Gemini, Bullish, and Kraken plan to list in the United States, hoping to seize this opportunity to position themselves as full-stack service providers for digital assets.
Coinbase's 2021 IPO
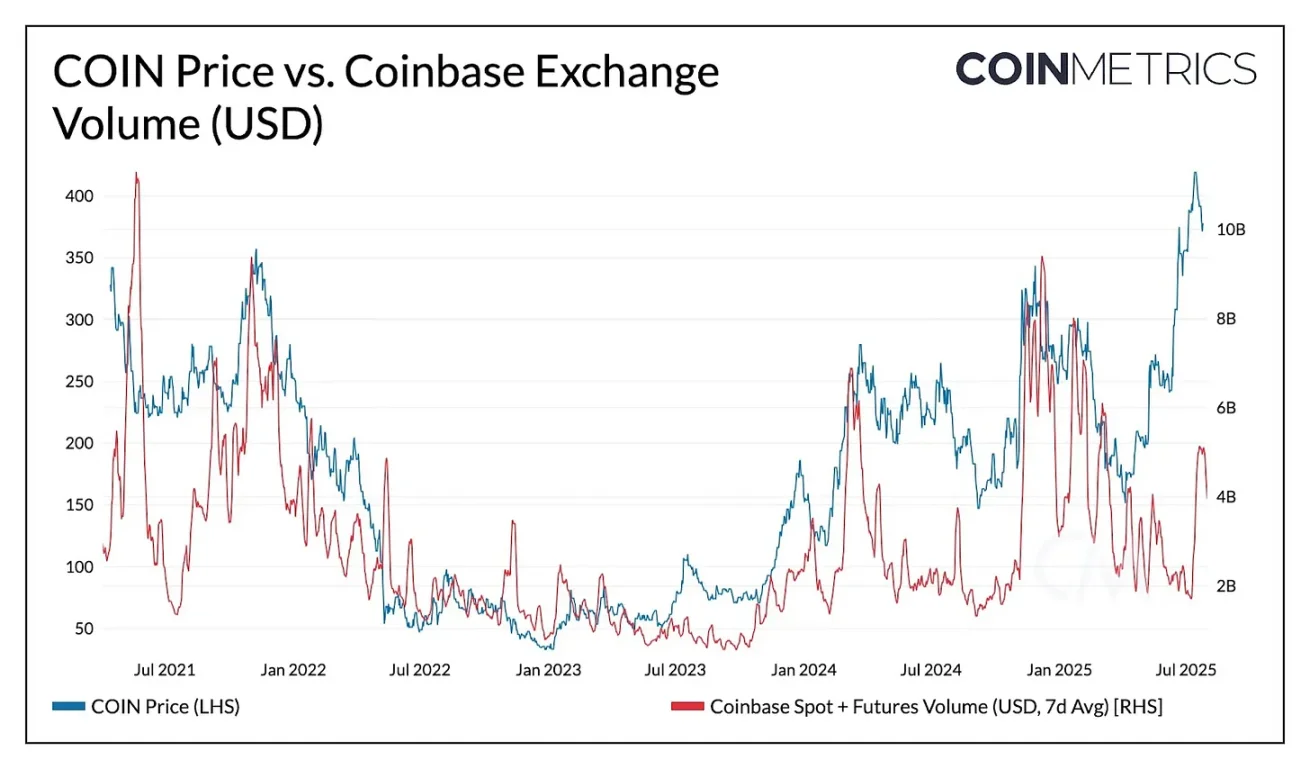
Coinbase's 2021 IPO provided a useful benchmark for assessing the investment prospects of potential trading platform IPOs. The company went public on April 14, 2021, through a direct listing on NASDAQ, with a reference price of $250 per share, resulting in a fully diluted valuation of $65 billion and an opening price of $381. Coinbase's IPO occurred at the peak of the 2021 bull market, when Bitcoin prices were nearing $64,000, and trading platform trading volumes exceeded $10 billion.
According to its S-1 filing, Coinbase's business model at the time was quite simple, with most of its revenue coming from trading fees:
‘From our establishment until December 31, 2020, we generated over $3.4 billion in total revenue, primarily from retail users and institutions based on trading volume fees on our platform. As of December 31, 2020, trading revenue accounted for over 96% of our net income. We leveraged the advantages of our trading business to expand and broaden the platform, launching new products and services through an investment flywheel and expanding the ecosystem.’
Source: Coin Metrics Market Data Pro and Google Finance
Today, Coinbase is more like a 'full-stack trading platform.' Although trading remains its core business, its business model has significantly expanded into the full-stack realm of cryptocurrency services. This change is beginning to reflect in the relationship between COIN price and trading volume, which were closely related in the early stages, but as the importance of 'subscription and service revenue' (including stablecoin income (USDC interest income), blockchain rewards (staking), custody income, etc.) has increased, this correlation has weakened.
Coinbase Q1 2021:
· Revenue of $1.6 billion
· Trading revenue of $1.55 billion (96%)
· Subscription and service revenue of $56 million (4%)
Coinbase Q2 2025:
· Revenue of $1.5 billion
· Trading revenue of $764 million (51%)
· Subscription and service revenue of $656 million (44%)
· Institutional interest income of $77 million (5%)
Comparative Analysis of Upcoming IPO Trading Platforms
Based on this framework, we have listed estimated data on the valuations, trading volumes, and business areas of trading platforms planning to go public.
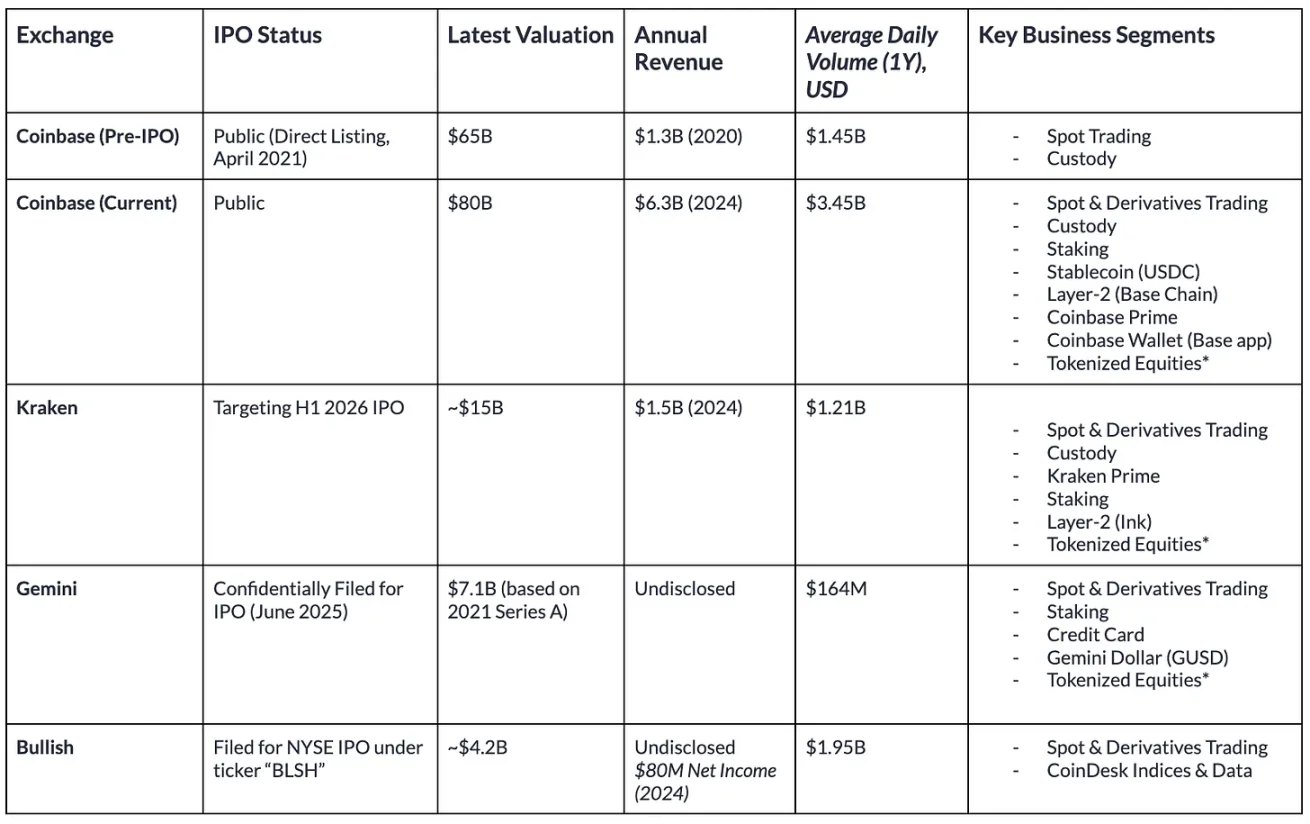
Source: Coin Metrics Market Data Pro and public company filings (data as of August 1, 2025)
While the services provided by these trading platforms tend to be similar, there are significant differences in market influence and trading activity scale.
Founded in 2013, Kraken has reached a more mature stage. The company's financial growth is strong, with 2024 revenue projected at $1.5 billion (up 128% from 2023) and Q2 2025 revenue at $412 million. Kraken is also strategically expanding into areas such as tokenized stocks, payments, and on-chain infrastructure (Ink) through the acquisition of NinjaTrader and obtaining European MiCA licenses. The target valuation is about $15 billion, with 2024 revenue of $1.5 billion, resulting in a revenue multiple of 10 times, slightly lower than Coinbase's 12.7 times.
In comparison, Gemini is smaller in scale. Its average trading volume over the past year was $164 million, the lowest among these trading platforms. Gemini's latest valuation goes back to a $7.1 billion Series A funding in 2021, with a private market valuation of $8 billion. In addition to spot and derivatives trading, Gemini also offers staking and credit card products, providing yields on user deposits, and is the issuer of the Gemini Dollar (GUSD), although its circulating supply has dropped to $54 million.
Bullish ranks high in trading activity, with an average trading volume of $1.95 billion over the past year. Bullish Exchange is at the core of its trading and liquidity infrastructure, focusing on institutional clients, and is regulated in Germany, Hong Kong, and Gibraltar, while actively seeking U.S. licenses. Additionally, Bullish has expanded into the information services sector by acquiring CoinDesk. According to the F-1 filing, the company reported a net profit of $80 million in 2024, with a net loss of $349 million. Based on the SPAC deal that was canceled in 2022, its initial valuation was nearly $9 billion, and it is now reportedly seeking a valuation of $4.2 billion.
Trading Volume Trends of Trading Platforms
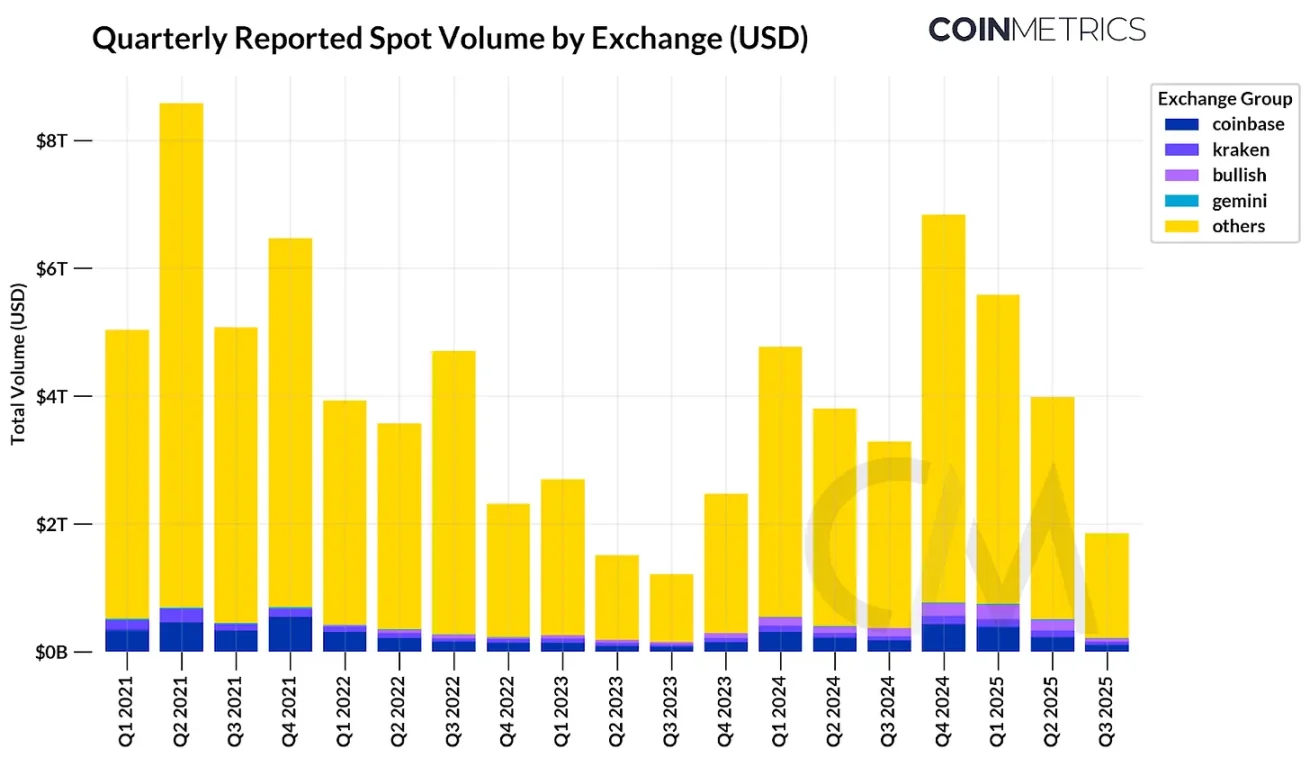
Source: Coin Metrics Market Data Pro
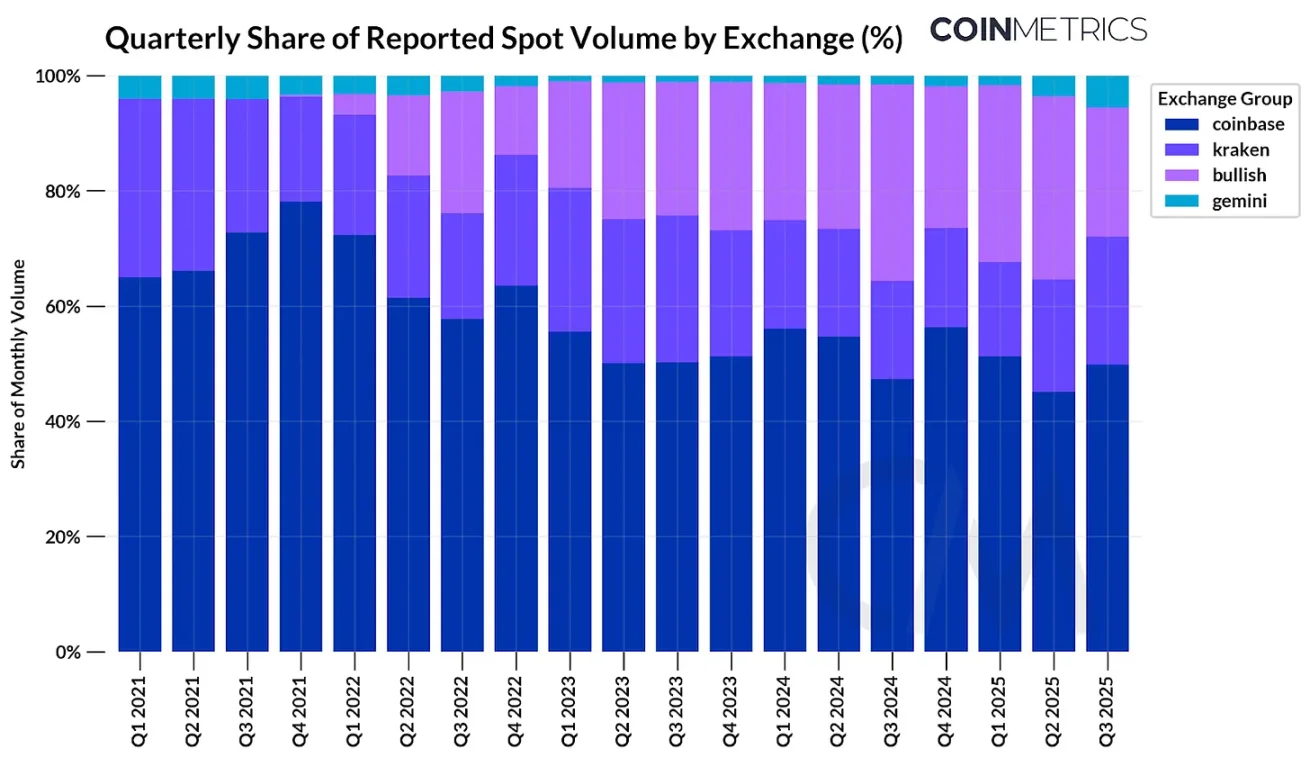
Overall, Coinbase and other trading platforms planning to go public account for only about 11.6% of the reported spot trading volume of centralized trading platforms. Binance alone accounts for 39%, while other offshore trading platforms also hold significant shares. Among the trading platforms of interest, Coinbase accounts for 49% of the spot trading volume, while Bullish and Kraken each account for 22%. Since its launch in 2022, Bullish's share has steadily grown, while Kraken's market share has shrunk due to increased competition.
Order Book Trading: Analyzing Economic Activity of Trading Platforms
As mentioned, trading volume is one of the most predictive indicators for estimating valuations. However, reported trading volumes may vary by trading platform, becoming a misleading data point.
Although most major cryptocurrency trading platforms have cracked down on wash trading, there are still some irregularities. Our trusted trading platform framework method details how to detect anomalous trading activity and evaluates qualitative factors such as regulatory compliance.
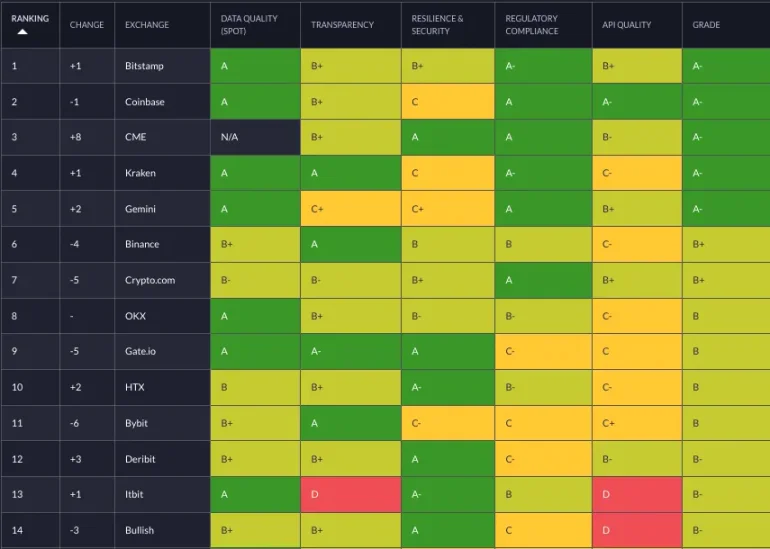
Source: Trusted Trading Platform Framework
A more robust signal for detecting buy-sell trades we developed is calculating the frequency of wash trades. Our testing method is as follows:
· We randomly sampled 144 five-minute periods from January to June 2025, resulting in nearly 20 million trades.
· For each trading platform and time period, select one trade.
· If another trade occurs within 10 transactions or 5 seconds, and in the opposite direction with almost the same amount and price (within 1%), then mark these two trades as wash trades.
· Repeat this operation for each trade. If a trade has been marked as a wash trade, skip it.
· Calculate the volume marked as wash trading and divide it by the total volume.
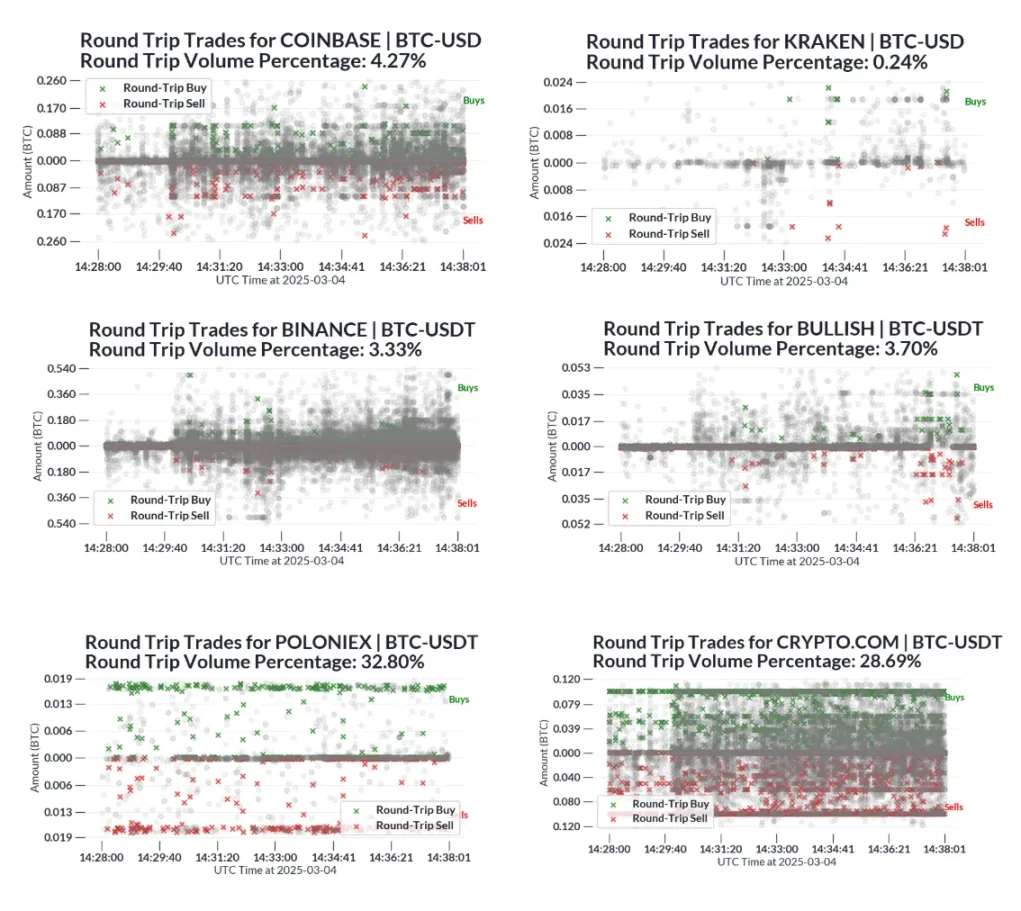
In the chart below, we plot samples of trades from a few trading platforms within a time period and label suspected wash trades. Each gray dot represents a normal trade, while green and red markers represent wash trades.
Source: Trusted Trading Platform Framework
Due to the approximation of this method, we expect some false positives, i.e., wash trades caused by normal market activities (such as market makers facilitating trades by providing liquidity on both sides of the order book). However, compared to industry baselines like Crypto.com and Poloniex, the higher percentage of wash trades raises concerns about the reliability of their reported trading volume data.
For example, from Q1 to Q2 2025, we estimate that Crypto.com’s BTC-USD ($201 billion), BTC-USDT ($192 billion), ETH-USD ($165 billion), and ETH-USDT ($160 billion) trading volumes are approximately $720 billion. Based on the aforementioned estimated proportions, about $160 billion of trading volume from these trading pairs comes from wash trading.
Conclusion
As several cryptocurrency trading platforms prepare to go public, investors need to understand the relative trading volumes of these platforms. While trading volume helps estimate trading revenue (which still constitutes most of the revenue), qualitative factors such as business diversification, the existence of wash trading, and regulatory compliance are also important considerations in assessing the quality of trading platforms. This information can help market participants judge whether the valuations are reasonable.
Four years after its IPO, Coinbase remains in a leading position, largely due to its diversification into revenue sources such as custody, stablecoins, and Layer-2 fees. However, competition in the trading platform market is intensifying. Other trading platforms must diversify their revenue sources away from heavily market sentiment-dependent trading fees to compete. As market structures gradually clarify, trading platforms are allowed to evolve from trading venues into comprehensive super apps. How these trading platforms seize this opportunity and whether they can realize their vision and replicate the success of past groundbreaking IPOs will be an important development to watch in the coming year.
Original Link


