The market is slowly entering a bearish zone, potentially creating conditions for a trend intensification.

As the asset falls back into the $2 range, XRP's price has also returned to the neutral $2 zone. This starkly contrasts with the strong bullish momentum observed a few days ago. From the daily chart, XRP failed to maintain its gains above a dollar. The recent decline occurred at the 26-day moving average (EMA), which is an important short-term resistance level that has now evolved into the upper limit of price action.
After peaking at around $3.70 in mid-July, XRP entered a correction phase. Once the asset breaks below the support level of $3.10 to $3.00, selling pressure increases. Recently dropping to the $2.94 to $2.95 range, XRP's technical position is precarious. A more important structural support level is around $2.35, aligning with the 200-day moving average; if it continues to close below this level, further declines below $2.69 and $2.60 could open up new support levels.
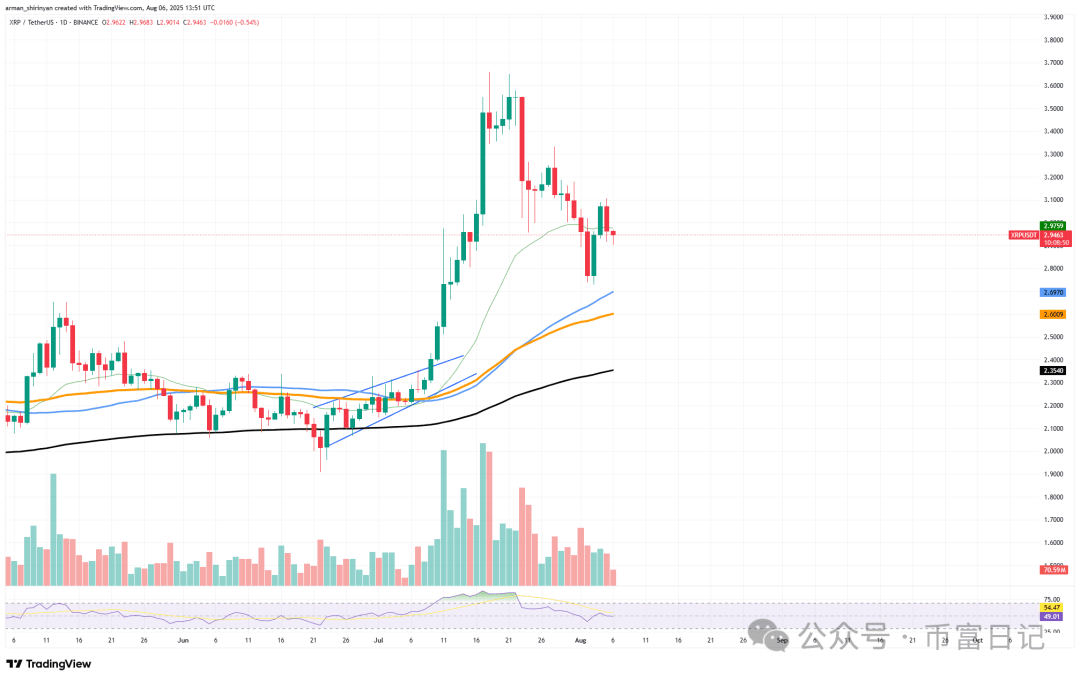
The volume trend further reinforces the bearish tone. The significant drop in trading activity during the pullback indicates that buyers are not as strong as during the rebound in early July. Momentum is weakening, and the Relative Strength Index (RSI) is clear evidence of this, having fallen from an overbought level above 75 to the current neutral zone of 54.
The short-term outlook for XRP is clear: to revive bullish sentiment, it must break above the 26-day moving average (approximately $3.05). Otherwise, XRP may further decline to the $2 range, as the path of least resistance seems lower. The momentum from XRP's mid-year surge still maintains an overall upward trend in the long term, but the situation is changing rapidly.
Bitcoin: This is what's holding it back.
Bitcoin is consolidating within a narrow technical range, with the 50-day moving average (close to $112,600) acting as short-term support, while the 26-day moving average serves as a direct resistance level. After retreating from a peak of $122,000 in mid-July, Bitcoin has been in a sideways consolidation due to the crossover of these moving averages. Recent price action suggests a stalemate between bulls and bears.
To avoid further losses, buyers have intervened at the 50-day moving average (EMA), while sellers have halted the upward momentum at the 26-day moving average (EMA). Depending on which side takes control, this contracting trading range may soon be broken. Additionally, the Relative Strength Index (RSI) is currently at 52 and on a downward trend. Compared to the overbought condition above 75 during the July surge, this undoubtedly provides some relief to investors.
The cooling of the RSI indicates that Bitcoin has shed some of the excessive bullish bubble, suggesting that a healthier foundation may exist before any further increase. BTC's retreat from the overbought territory may be seen as a positive reset in terms of market sentiment, especially if it stays above the 50-day moving average. A strong break above the 26-day moving average would reopen the pathway towards $118,000-$120,000. If inflows resume, the resistance at $122,000 will again become a focal point. However, if it falls below the 50-day moving average, it may retest $108,200, which is the intersection of the 100-day moving average and the previous price consolidation area.
Shiba Inu bulls lose control.
Recent price movements indicate that bulls no longer control the market, and 'Shiba Inu' once again disappoints bullish traders. SHIB hasn't even had a chance to test the 50-day exponential moving average (EMA) before experiencing a slight rebound attempt, after which momentum weakened, indicating insufficient market confidence and weak buying pressure.
Historically, the 50-day moving average has been a reliable mid-term resistance level, with the current trading price close to $0.00001296. Before encountering resistance, SHIB had at least attempted to test this level during previous rebounds. However, the sudden reversal as the price approached this area indicates that sellers still fully control the market. This rapid pullback suggests a widespread shift in market sentiment.
Earlier this year, retail investors participated heavily in SHIB due to a brief speculative rebound. The current price structure shows lower highs and declining volume, highlighting the weakening bullish momentum. The failure to even challenge the 50-day moving average indicates that market participants are unwilling to build long positions in the absence of strong catalysts.
If SHIB continues to hold above $0.0000120, a short-term support area will form. However, if it falls below this level, the decline could accelerate to the $0.0000115 to $0.0000110 range, which has stronger historical support levels. During this period, any rebound attempts will face multiple resistances, starting from the 50-day moving average and extending to the $0.00001324 to $0.00001450 area.
With no signs of an imminent reversal, the Relative Strength Index (RSI) remains low at around 44. In the absence of new buying inflows or overall market enthusiasm, SHIB faces the risk of a slow decline, leading opportunistic traders to wait for larger discounts before re-entering. In summary, the recent failure of a rebound attempt further proves that bears currently control the Shiba Inu market.


