🔺 Trend & Market Structure
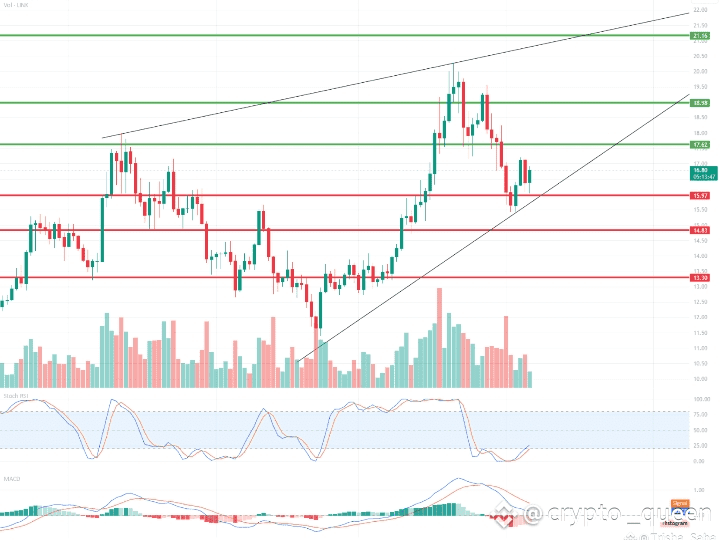
LINK is currently in a bullish uptrend, forming higher highs and higher lows within an ascending price channel (outlined by black trendlines).
The latest bounce came from around $14.83, aligning with the channel’s lower boundary.
📌 Key Levels
🟩 Resistance:
$18.98 – Recent local high
$21.16 – Major resistance; likely target if $19 breaks
$18.27 – Active resistance being tested
$17.62 – Mid-range resistance
🟥 Support:
$15.97 – First local support
$14.83 – Key support level (bounced here recently)
$13.30–$13.50 – Strong demand zone
$12.50 – Long-term historical support
📊 Technical Indicators
🔄 Stochastic RSI:)%K and %D lines are crossing upward from oversold territory → bullish signal
Indicates potential price continuation upward
📉 MACD:
Histogram still declining, but the downtrend is slowing
A bullish crossover may occur soon if momentum builds
🔊 Volume:
Volume spikes during upward moves confirm strength
Recent low volume suggests either consolidation or an upcoming move
📈 Bullish Scenario:
Price holds the uptrend and breaks above $18.27 and $18.98
Could rally toward $21.16
Confirmed by MACD or Stoch RSI crossover
📉 Bearish Scenario:
Drop below $15.97 and the trendline could lead to $14.83, then possibly $13.30
Weak MACD may support this move if buyers fail to step
🧠 Summary:
Overall Trend: Bullish
Currently testing $18.27 resistance
Key supports to watch: $15.97 and $14.83
Indicators suggest a poten
tial upward continuation, but confirmation on volume or higher timeframes is essential