📊 Simple Market Analysis (for Beginners)
🔹 Current Price:
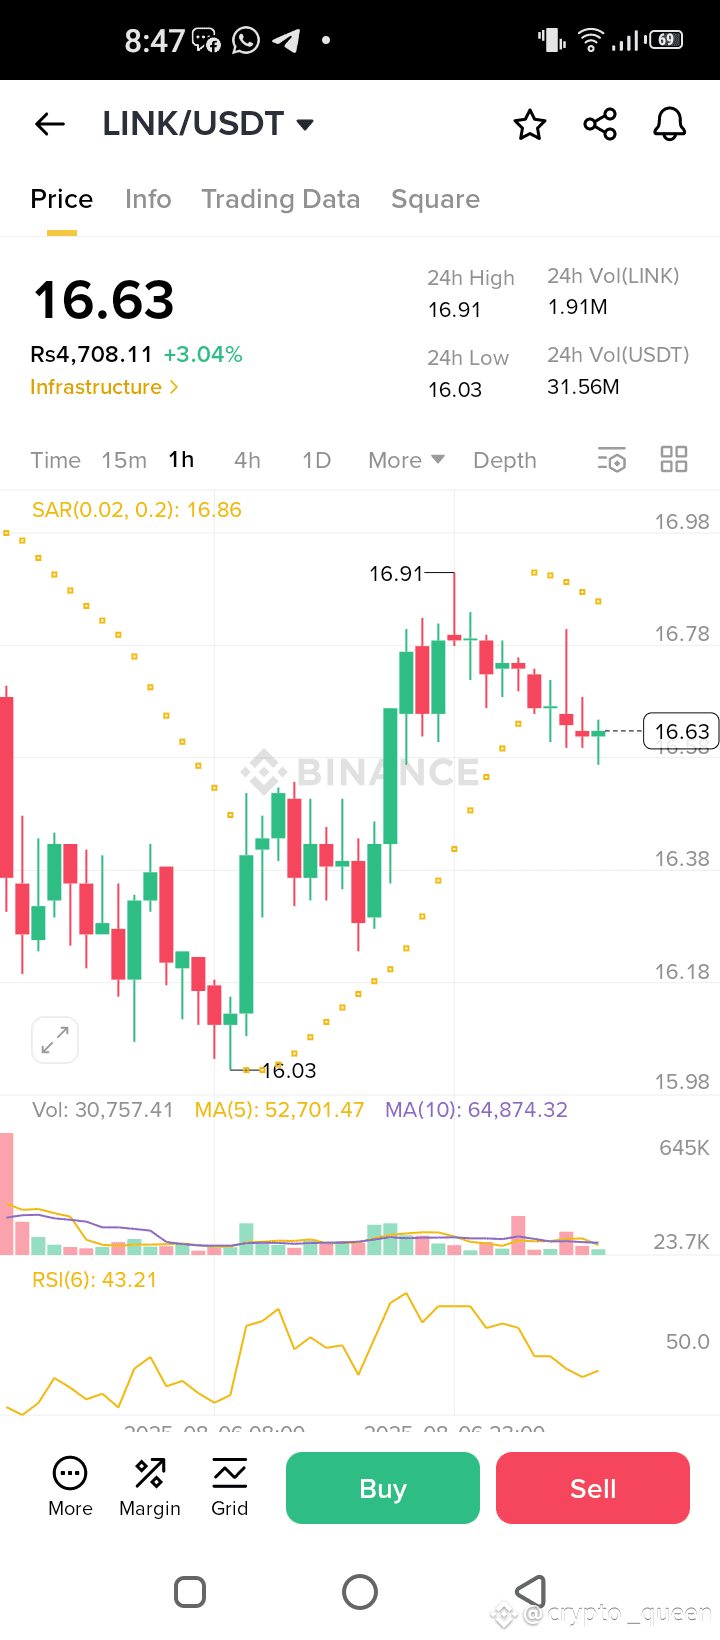
LINK is trading at $16.63.
📈 Trend Overview:
✅ Recent candles mostly green = upward momentum.
🔼 Parabolic SAR dots are below price = uptrend still intact.
⬇️ Price hit a high of $16.91, then pulled back slightly.
📉 Recent Price Action:
📉 A small drop from the high.
🛑 Appears to be finding support near the current price.
📊 Volume Activity:
🔼 High volume + green candle = strong buying interest.
🔽 High volume + red candle = strong selling interest.
🧭 Volume spikes suggest active trading interest.
💪 RSI (Relative Strength Index):
🧮 RSI is 38.66 – not overbought or oversold.
🟰 Suggests the price has room to move either way.
📌 What This Means for You (Beginner):
1. 💵 LINK is at $16.61, up +3.17% in 24h.
2. ⏫ Short-term trend (1-hour candles) = upwards, but now cooling off.
3. 🧘 Indicators (SAR & RSI) = neutral – not a clear buy or sell.
4. 👀 Wait for
clearer signs or confirmation before making moves.