There are a group of people in the market who do not judge based on visual and auditory information but rather on wisdom. They do not look at fundamentals and news, do not participate in group chats, and do not use technical indicators or other superficial tools.
Their judgments are based on the market's own behavior; they study the order book and volume-price relationship, then predict the next developmental direction based on supply and demand relationships and formulate crisis management methods for potential failures. Thus, their operations become a process with ample preparation and wisdom investment. We call these people smart money.
The essence of trading
In microeconomics, the essence of making money lies in "guiding demand and controlling supply."
This strategy is very effective in freely traded markets such as the stock market. What are the main players in free trading markets doing? How do they make profits?
The way operators make profits can be simply summarized in two steps:
1. Guide demand: Satisfy various needs to attract retail investors to enter the market.
2. Control supply: Use various means to acquire a large number of low-priced monopoly chips, thereby gaining bargaining power and then distributing at high prices for profit.
The world is a huge stage, and the entire trading market is a vast mouse warehouse.
Retail investors have little chance of winning when facing off against the main players in the market, as the disparity in capital scale leaves them with no bargaining power. Therefore, I recommend that small retail investors do not imitate the big players' left-side bottom fishing and low buying-high selling thinking, but choose to trade in the direction of the trend on the right side. Right-side trading is essentially "borrowing strength," leveraging the main players' momentum: letting the main players become our windfall, allowing us to soar easily on the wind.
The Wyckoff Trading Method clearly explains trading strategies centered around operator behavior. The Wyckoff Trading Method is a technical analysis approach proposed by Richard Wyckoff in the early 20th century. Although it is not as well-known as Dow Theory or Elliott Wave Theory, Wyckoff's theory offers unique advantages in understanding market behavior and main player manipulation.
Wyckoff Trading Method
Wyckoff's trading theory divides market traders into two major categories: institutions and retail investors.
Institutional traders typically adopt professional and systematic trading methods. If retail traders can familiarize themselves with these trading strategies, they may profit alongside the institutions.
The Wyckoff Trading Method not only focuses on the price itself but also pays special attention to the analysis of trading volume and market structure, which makes it very useful for understanding and predicting the behavior of main players. By identifying different phases of the market and the operational techniques of the main force, traders can better grasp market trends and avoid being "washed" or "misled" by the main players.
The core of the Wyckoff Trading Method lies in four points: market cycles, supply-demand laws, causality laws, and market structure.
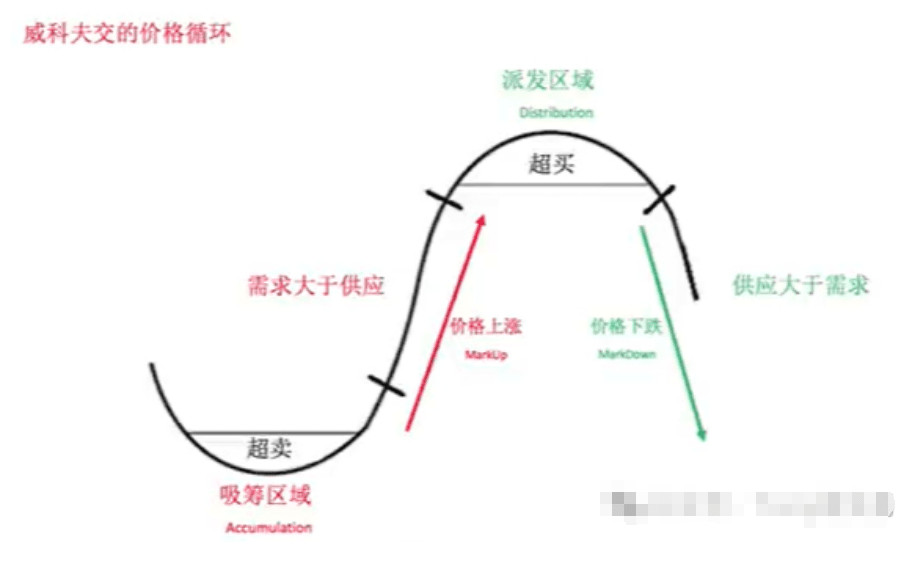
Market cycles
Wyckoff believes the market is divided into four stages: accumulation, rising, distribution, and falling. Each stage has specific characteristics and trading signals.
1. Accumulation Phase
During the accumulation phase, the market usually experiences a long period of horizontal consolidation. The main institutions quietly buy stocks during this phase, absorbing selling pressure from the market in preparation for subsequent upward movements.
Characteristics and trading signals:
Low price range: Prices fluctuate at low levels with low trading volume.
Narrow trading range: Price fluctuation amplitude is small, forming a bottom area.
Multiple tests at the bottom: Prices test lower points multiple times but fail to break through the lower support.
Gradual increase in volume: As the main force gradually absorbs shares, trading volume will slowly increase.
2. Rising Phase
In the rising phase, after sufficient absorption, the main force begins to push up the stock price. At this time, market sentiment begins to turn optimistic, and more investors start to enter.
Characteristics and trading signals:
Price breakthrough: Prices break through the upper resistance level of the accumulation phase, forming an upward trend.
Increased trading volume: Trading volume significantly increases, indicating strong buying demand in the market.
Small pullback amplitude: During the upward process, the pullback amplitude is small, indicating strong market momentum.
Higher highs and lows: Prices continuously create new highs and lows, forming an upward channel.
3. Distribution Phase
In the distribution phase, the main force begins to gradually distribute its chips, and market sentiment starts to turn cautious. Prices fluctuate at high levels, and trading volume increases.
Characteristics and trading signals:
High price range: Prices oscillate at high levels with significant trading volume.
Wide fluctuations: Price fluctuation amplitude increases, forming a top area.
Multiple attempts at high points: Prices test high points multiple times but fail to break through resistance.
Volume increases with stagnation: Despite high trading volumes, price movements are weak, indicating insufficient upward momentum.
4. Declining Phase
In the declining phase, the main force has completed distribution, and the market begins to decline significantly. At this point, market sentiment turns pessimistic, and investors begin to sell stocks.
Characteristics and trading signals:
Price breaks below support: The price breaks through the lower support of the distribution phase, forming a downward trend.
Trading volume increases: Trading volume significantly expands, indicating strong selling pressure in the market.
Small rebound amplitude: During the downward process, the rebound amplitude is small, indicating market weakness.
Lower highs and lows: Prices continuously create new lows and highs, forming a downward channel.
Supply-demand law
Price changes are determined by the supply-demand relationship in the market. The saying goes, 'scarcity increases value'; when supply decreases and demand increases, prices naturally rise; conversely, when supply increases and demand decreases, prices fall. By observing the relationship between trading volume and price, one can judge the market trend and strength.
The basic principle of the supply-demand law
1. Supply (Supply):
Supply reduction
When the supply of a certain commodity or asset in the market decreases, scarcity increases, leading to price rises. For example, a reduction in the circulation of a stock or a company's stock buyback will reduce market supply and push up prices.
When supply increases, goods or assets become more abundant, leading to a price decline. For example, new shares issued by a company or a large sell-off in the market will increase supply and lower prices.
2. Demand (Demand):
Demand increases
When the demand for a certain commodity or asset increases in the market, buyers compete to purchase, leading to price increases. For example, if investors are optimistic about a company's prospects and buy large amounts of its stocks, it will push up the stock price.
Demand reduction: When demand decreases, buyers reduce their activity, leading to price declines. For example, insufficient confidence in a certain industry's stocks can lead investors to sell off related stocks, causing price drops.
Market performance of supply-demand relationships
1. Price rising phase
Demand exceeds supply
When demand exceeds supply, buyers gain the upper hand, leading to price increases.
Volume-price relationship: Trading volume increases, and prices rise, indicating that the market is in a buyer-dominated state.
2. Price decline phase
Supply exceeds demand
When supply exceeds demand, sellers gain the upper hand, leading to price declines.
Volume-price relationship
Trading volume increases while price decreases, indicating that the market is in a seller-dominated state.
3. Price Consolidation Phase
Supply-demand balance
When supply and demand are roughly balanced, prices fluctuate within a certain range.
Volume-Price Relationship
Trading volume is low, and price fluctuation amplitude is small, indicating that the market is in a wait-and-see state.
Judging market trends through the relationship between trading volume and price
1. Volume-price increase
When both trading volume and price increase simultaneously, it indicates strong buying pressure in the market, and future prices are likely to continue rising. This situation usually occurs in the early or mid stages of an upward trend.
2. Volume-price decline
When both volume and price decrease simultaneously, it indicates strong selling pressure in the market, and future prices are likely to continue to decline. This usually occurs in the early or mid stages of downtrends.
3. Price rises while volume shrinks
When prices rise while trading volume decreases, it indicates insufficient upward momentum, which may be a signal of the end of the upward trend and requires caution regarding market reversals.
4. Price decline with volume shrinkage
When prices decline and trading volume also decreases, it indicates insufficient downward momentum, which may be a signal of the end of the downward trend and requires attention to market rebound opportunities.
5. Volume increases while price remains stable
When trading volume increases but prices remain stable, it may indicate that the market is about to choose a direction. A large amount of trading activity may indicate that the main force is absorbing or distributing.
The supply-demand law may seem simple, but it cannot be ignored.
The entire market is a continuous wave of alternating bull and bear cycles, and the underlying reason for this cyclical law is the changes in supply and demand.
In a bear market, the side holding more chips is unwilling to circulate them, leading to an upward pressure on supply, and prices naturally rise; conversely, when prices are too high, exceeding people's psychological expectations, demand decreases, and prices naturally fall. The combination of countless small cycles of price fluctuations forms the large cycle of bull-bear transitions.
The principle of causality
The amplitude of price movement depends on the previous volume of accumulation or distribution. During the accumulation phase, the main force gradually absorbs shares, forming a foundation for upward movement; in the distribution phase, the main force gradually sells off, forming a foundation for downward movement. Previous absorption must occur before distribution can happen. After one round of price cycles ends, a new price cycle may begin.
For example, in some market conditions, so-called false breakouts often occur. Suppose there are two types of market conditions, both of which are breakouts after oscillation.
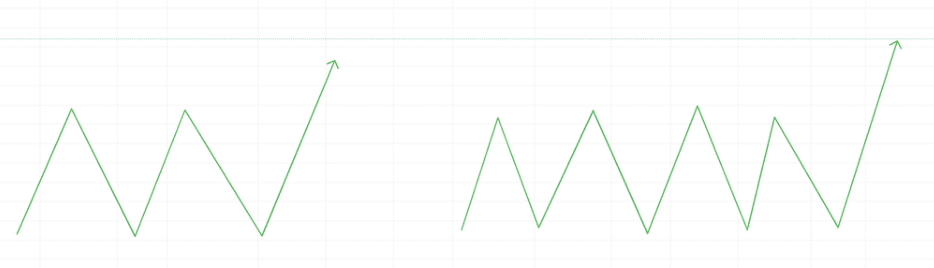
In the first type of market condition, the price often falls back after a breakout, but in the second type, after prolonged oscillation, the breakout continues to rise, potentially soaring.
Using Wyckoff's theory to explain, this is because, in the second type of market condition, the main force has absorbed enough shares, which is why the subsequent price increase has staying power; whereas, in the first type of condition, the absorption is insufficient, making sustained price increases very difficult. Therefore, there is a saying in trading: "The longer the horizontal range, the higher the vertical range." Stocks that have been consolidating at the bottom for a long time often explode impressively when they finally do.
The principle of effort and results
Large trading volumes should correspond to large results, meaning significant price fluctuations are represented by longer K-lines. If the price change (result) is inconsistent with trading volume (effort), it may signal a trend reversal.
The basic principles of the volume-price relationship
1. Volume-price increase
When both trading volume and price increase simultaneously, it indicates strong buying pressure in the market, and future prices are likely to continue rising. This situation usually occurs in the early or mid stages of an upward trend.
For example, when a stock breaks through a significant resistance level, trading volume significantly increases, and prices rise sharply, indicating strong buying power in the market.
2. Volume-price decline
When both trading volume and price decline simultaneously, it indicates strong selling pressure in the market, and future prices are likely to continue to decline. This usually occurs in the early or mid stages of downtrends.
For example, when a stock breaks below a significant support level, the trading volume significantly increases, and the price sharply declines, indicating strong selling pressure in the market.
Volume-price imbalance signals
1. Price rises while volume shrinks
When prices rise while trading volume decreases, it indicates insufficient upward momentum, which may be a signal of the end of the upward trend and requires caution regarding market reversals.
For example, if a stock continues to rise after a period of bullish movement but trading volume gradually decreases, it indicates weakening buying power, and the market may soon turn down.
2. Price drop with volume shrinkage
When both price and volume decrease, it indicates insufficient downward momentum, which may be a signal of the end of a downtrend and requires attention to market rebound opportunities.
For example, if a stock continues to decline after a period of bearish movement but trading volume gradually decreases, it indicates weakening selling pressure, and the market may soon turn upward.
3. Volume increases while price remains stable
When trading volume increases but prices remain stable, it may indicate that the market is about to choose a direction. A large amount of trading activity may indicate that the main force is absorbing or distributing.
For example, if a stock experiences a sudden increase in volume at high or low price levels but little price fluctuation, it may indicate that the main force is distributing at high levels or accumulating at low levels, and the market is about to choose a direction.
The risk of large transactions at high levels
If a large number of transactions occur at high prices but the price does not continue to rise significantly, it may indicate that the operators have started to distribute.
For example, if a stock experiences a significant increase in trading volume at a high price level but fails to continue rising, it indicates increased selling pressure, and the main force may gradually distribute chips. At this point, investors need to be wary of sudden price drops.
Market structure
Wyckoff analyzes different market structures, such as support and resistance levels, trading ranges, etc., to identify buying and selling opportunities. Understanding and analyzing market structure is a core part of the Wyckoff Trading Method, helping traders better grasp market dynamics and formulate effective trading strategies.
1. Support and resistance levels
Support level
The support level is a strong buying area that prices may encounter during declines. Support levels are typically previous low points where prices rebounded after falling. Wyckoff's theory suggests that support levels are key areas for the main force's absorption; when prices approach support levels, buying pressure increases, and prices often stop falling and rebound.
Characteristics: Prices repeatedly test lower levels but fail to break through effectively, while trading volume gradually increases near support levels.
Trading opportunities: When prices approach support levels and trading volume increases, it may indicate a buying opportunity.
Resistance level
The resistance level is a strong selling area that prices may encounter during rises. Resistance levels are typically previous high points where prices fell back after rising. Wyckoff's theory suggests that resistance levels are critical areas for the main force's distribution; when prices approach resistance levels, selling pressure increases, and prices often encounter resistance and fall back.
Characteristics: Prices repeatedly attempt to rise but fail to break through effectively, while trading volume gradually increases near resistance levels.
Trading opportunities: When prices approach resistance levels and trading volume increases, it may indicate a selling opportunity.
2. Trading Range
The trading range is the area where prices fluctuate within a certain range, typically displaying the accumulation or distribution phase in the market. Wyckoff identifies market movements within this trading range to judge the next movement direction of the market.
Accumulation range
The accumulation range is the area where prices consolidate at low levels, and the main force quietly absorbs shares. The lower boundary of the accumulation range is the support level, and the upper boundary is the resistance level.
Characteristics: Prices fluctuate repeatedly in low price ranges, with trading volume gradually increasing at the bottom.
Trading opportunitiesWhen prices break through the upper boundary of the accumulation range, and trading volume increases, it is a buying signal.
Distribution range
The distribution range is the area where prices consolidate at high levels, and the main force gradually distributes chips in this area. The lower boundary of the distribution range is the support level, and the upper boundary is the resistance level.
Characteristics: Prices fluctuate repeatedly in high price ranges, and trading volume gradually increases at the top.
Trading opportunities: When prices break below the lower boundary of the distribution range and trading volume increases, it is a selling signal.
3. False breakouts and effective breakouts
False breakout
A false breakout refers to the price briefly breaking through the support or resistance level and then quickly falling back. False breakouts are typically used by the market's main force to mislead retail investors by creating illusions, thereby acquiring more chips or realizing distribution.
Characteristics: Price breaks through support or resistance and then quickly falls back, with trading volume unusually increasing or decreasing.
Trading opportunities: A pullback or rebound after a false breakout is an opportunity for contrarian operations.
Effective breakout
An effective breakout refers to the price continuing to operate after breaking through the support or resistance level, accompanied by a significant increase in trading volume. An effective breakout usually signals further development of the market trend.
Characteristics: Price breaks through support or resistance and continues to operate, with trading volume significantly increasing.
Trading opportunitiesA pullback or rebound after an effective breakout is an opportunity for trend-following operations.
From the main force's perspective
In the market, whether prices are rising or falling, they are inseparable from the driving force of the main players.
The Matthew effect tells us that those with more capital find it easier to earn money; the strong in the market can usually maintain their advantageous positions. In contrast, retail investors, as fuel cells in the market, are numerous but behave in a highly uniform manner, making them easy targets for the main force's manipulation. The information they acquire is often guided or deliberately created by platforms, resulting in information asymmetry. Without independent thinking abilities, retail investors can easily become passive participants in market fluctuations.
If we think from a different perspective, suppose you are the main force in the market. When you review the market's K-line chart, you will see many signs reflecting retail behavior. No longer focusing solely on personal interests, but considering how to help the main force earn money. Pay attention to whether the market price is within a controllable range for the main force; if deviations occur, how the main force should adjust strategies to preserve profits and release information to control chip prices.
Market bear and bull cycles are not endpoints but strategies for main players to implement low-priced absorption and high-priced profit-taking. This strategic operation needs to consider market supply-demand relationships and capital flow from a long-term perspective, rather than focusing on singular trading short-term benefits.
This "perspective shift" is somewhat akin to "altruism" or "upward socializing."
For example, in the K-line chart below, continuous thick solid bearish lines can be understood as the main force's dumping actions, disrupting market order through "can" low-priced distributions.
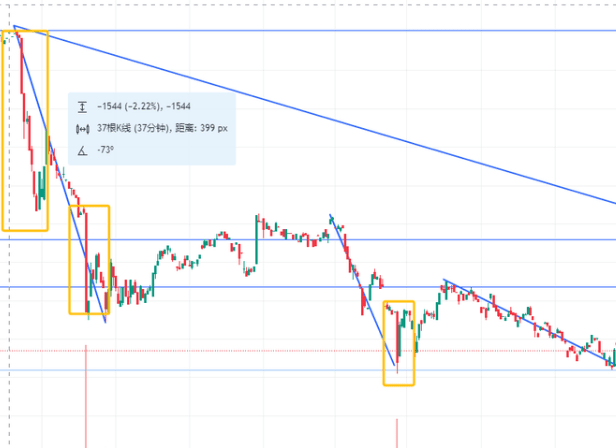
A classic washout action
In market distress, retail investors often fall into panic selling, stop-loss exits, and other behaviors, actively or passively surrendering their chips. This chaotic market pattern provides opportunities for the main force, as retail investors' panic often creates favorable conditions for the main force's operations.
In contrast, as the main force, there is no need for excessive skills or tricks. The gap in capital size itself is an insurmountable chasm. The logic of the main force’s behavior can be summarized into several key stages: absorbing and building positions, washout, price increase, and distribution.
Each stage has its unique operational methods and purposes. Each step in these stages can adopt various methods and strategies, each with its pros and cons. However, regardless of the chosen strategy, the main force always weighs safety, time efficiency, and total profitability as the three key indicators. As qualified operators, the key is to choose the most suitable strategy combination based on the specific circumstances of the market.
This strategic operation method allows the main force to respond flexibly to market fluctuations, thus gaining an advantageous position in the market and achieving steady profits.
Basic skills to become a main force
The following is a detailed introduction to the accumulation and building phase, including price suppression methods, horizontal consolidation methods, and price increase methods.
1. Absorbing and building positions
Absorbing and building positions is the process where the main force gradually buys a large number of stocks at low prices to lay the foundation for subsequent operations. During this stage, the main force hopes to accumulate enough chips at a lower cost while avoiding early market attention. The process of absorbing and building positions is usually divided into the following methods:
Price suppression method
Definition: The price suppression method is a way of absorbing shares by pushing down stock prices. The main force deliberately creates selling pressure, causing stock prices to fall, in order to absorb chips at lower price levels.
Operation Steps:
1. Generate unfavorable news: The main force may release negative news about the stock through various channels to create a pessimistic atmosphere, prompting retail investors to sell stocks. 2. Large orders selling: Placing large sell orders during the trading day to suppress stock prices and entice the market to follow suit in selling. 3. Gradual absorption: Once the stock price is suppressed to a certain extent, the main force gradually buys to complete absorption.
Advantages:
Can acquire a large number of chips at lower prices.
By creating market panic, competition during the absorption process is reduced.
Disadvantages:
Operational difficulty is high and requires strong market control abilities.
May attract regulatory attention due to excessive suppression.
Horizontal consolidation method
Definition: The horizontal consolidation method is a way of absorbing shares by keeping stock prices fluctuating within a narrow range for a long time. The main force repeatedly buys and sells within this range, gradually absorbing shares.
Operation Steps:
1. Maintain stock prices: Within a certain price range, the main force maintains stock price stability through buying and selling operations, preventing significant price fluctuations. 2. Disguise trading volume: During the consolidation process, the main force creates a certain trading volume through a small number of frequent trades, disguising the true supply-demand situation in the market. 3. Gradual buying: The main force gradually absorbs chips within a small fluctuation range.
Advantages:
The absorption process is covert and does not easily attract market attention.
Can better control costs and avoid significant price fluctuations.
Disadvantages:
It takes a long time to complete the building of positions.
Requires the main force to continuously monitor market dynamics, making the operation relatively complex.
Price increase building method
Definition: The price increase building method is a method of absorbing shares by raising stock prices. The main force pushes up stock prices significantly through large purchases to attract market attention and absorb shares at high prices.
Operation Steps:
1. Generate favorable news:
The main force may attract market attention and capital inflow by releasing favorable news.
2. Large order buying:
By placing large buy orders during trading, the main force rapidly pushes up stock prices to attract follow-up buying.
3. High-position absorption:
After the stock price is pushed up, the main force uses the opportunity of market following to gradually sell chips to the market, completing the absorption.
Advantages:
Can quickly attract market attention and complete the absorption process.
The operation speed is fast, suitable for the main force's urgent need to build positions.
Disadvantages:
The cost of absorption is relatively high and may require a larger capital volume.
High operational risk; if the market response is not as expected, it may not be possible to complete the absorption smoothly.
2. Washout
Washout is when the main force, after completing the absorption and building positions, uses certain methods to clear floating chips and short-term profit-taking in the market, aiming to leave stable chips behind, which is a crucial strategic thinking.
1. The necessity of oscillation washout
Only through repeated oscillation can those profit-taking chips that originally hoped to earn a bit more be forced out. After the market experiences multiple roller coasters, investors will realize other investment opportunities outside, such as AI, MEME, etc., and will feel that they should not continue to stay in their original assets. Prolonged oscillation will make investors realize that this market adjustment may not just be temporary, thus accelerating the outflow of profit-taking chips.
2. Stabilizing chips' sedimentation
A prolonged washout process, like the previous #PEPE example, can help the main force leave stable chips. After a period of washout, those willing to hold and withstand market fluctuations will settle. After the main force absorbs enough chips, they will stop absorbing and begin to raise prices. If the chips are unstable, once the price is raised, they will face selling pressure, and ultimately the chips will flow back to the main force. To ensure the long-term stable development of a cryptocurrency, the main force must leave enough stable chips during the washout phase to lower turnover rates, allowing them to easily raise the coin price with smaller funds.
3. The exit of short-term funds
Only through a long washout process can those short-term speculative funds in the market be completely forced out. These funds often cannot withstand long-term market fluctuations and tests, making it difficult to hold for several months. Through washouts, the market can eliminate various unstable chips, creating conditions for a new starting point in the next market cycle.
The following are several common washout methods: pit digging washout, horizontal washout, and high opening low closing washout.
Pit digging washout
Pit digging washout involves creating a price decline over a period, forming a 'pit' shape, forcing indecisive investors to sell stocks, thereby achieving the washout goal.
Operation Steps:
1. Suppress stock prices: The main force quickly suppresses stock prices through large sell orders or creating unfavorable news. 2. Form a 'pit' shape: After a period of price decline, the stock stabilizes at a certain low point, forming a 'pit' shape on the chart. 3. Absorb shares at low prices: The main force quietly absorbs sold chips at price lows, further concentrating holdings.
Advantages:
Effectively clears floating chips, making chips more concentrated.
By creating panic, it forces indecisive investors to sell.
Disadvantages:
Operational time is relatively long, which may damage market confidence.
If the market environment is poor, it may lead to difficulty in quickly recovering stock prices.
Horizontal washout
Horizontal washout maintains stock prices within a relatively narrow range, wearing down market patience to achieve the goal of clearing floating chips.
Operation Steps:
1. Control stock price fluctuations: The main force uses buying and selling operations to maintain the stock price within a narrow range of oscillation. 2. Generate trading volume: Through a small number of frequent trades, create a certain trading volume to mask the true intentions of the main force. 3. Wear down patience: Due to the long-term fluctuation of the stock price within a range, some investors will lose patience and sell their stocks.
Advantages:
Operations are covert and not easily detected by the market.
Can effectively clear floating chips and short-term funds.
Disadvantages:
Time-consuming, requiring the main force to continuously monitor market dynamics.
Requires a considerable degree of operational patience and skills.
High opening low closing washout
High opening and low closing washout is achieved by significantly raising stock prices at the opening and then quickly falling back, causing investors who bought at high levels to be trapped, thus achieving the goal of washout.
Operation Steps:
1. Opening high: The main force makes large purchases at the opening to rapidly push up stock prices. 2. Quick retracement: Then, through large sell orders, the main force quickly suppresses stock prices, causing investors who bought at high levels to be trapped. 3. Clearing floating chips: Short-term investors who bought at high levels may sell their stocks during the price retracement, thus clearing floating chips.
Advantages:
The operation speed is fast, enabling swift achievement of washout objectives.
Can effectively clear short-term funds and floating chips.
Disadvantages:
The operational difficulty is relatively high and requires precise timing and capital allocation.
Easily triggers market panic; if operations are not handled properly, it may lead to significant declines in stock prices.
After the main force completes absorption and washout, it will enter the phases of price increase and distribution. These two phases are crucial for the main force to realize profits. The most commonly used methods for price increase and distribution are oscillation.
3. Price Increase
The price increase phase is when the main force, after absorbing shares and consolidating, pushes up the stock price to achieve value appreciation. During this phase, the main force will use various means and market forces to rapidly raise stock prices, attracting market followers to buy. As a main force, how should we increase the price?
Oscillation Price Increase Method
Definition: The main force gradually pushes up the stock price through alternating phases of price increases and adjustments.
Operation Steps:
The main force rhythmically raises the stock price over a period and then makes slight retracements to shake off short-term speculative positions.
During the retracement process, continue to absorb the sold chips to consolidate positions.
Advantages:
The operation is relatively stable, attracting more medium and long-term funds.
Market psychological fluctuations are small, not easily triggering panic selling.
Disadvantages:
Time-consuming and relatively complex operations.
High requirements for the main force's capital allocation and operational skills.
Rapid Price Increase Method
Definition: The main force continuously buys in large amounts within a short period, rapidly pushing up the stock price, creating a swift upward momentum.
Operation Steps:
The main force continuously buys large orders over multiple trading days, pushing up the stock price.
Attract market funds to follow up by releasing favorable news or creating market hotspots.
Advantages:
Completing the price increase in a short time attracts market attention.
Easily creates strong upward expectations, attracting more funds into the market.
Disadvantages:
High capital requirements and operational difficulty.
In some financial markets, too rapid a price increase may attract regulatory attention.
4. Distribution
Distribution is a phase where the main force gradually sells the holdings to realize profits after the stock price reaches a certain height. The main force needs to sell chips at as high a price as possible while maintaining market expectations for rising prices.
High Position Oscillation Distribution
Definition: The main force gradually sells the chips in hand through stock price oscillation at a high position.
Operation Steps:
The main force repeatedly makes slight price increases and retracements within a high price range to maintain price fluctuations.
During each slight price increase, gradually sell chips.
By releasing favorable news or market hotspots, maintain market buying enthusiasm.
Advantages:
Can maintain selling at high positions for a long time, ensuring profit maximization.
Not easily triggering market panic, the selling process is relatively smooth.
Disadvantages:
Time-consuming and complex operations.
Requires sustained market attention and operational skills.
Rapid Distribution MethodDefinition: The main force rapidly completes distribution by selling large orders within a short time.
Operation Steps:
The main force quickly sells large orders after the stock price reaches the target price, completing the distribution of chips.
By releasing favorable news or market hotspots, attract more buying in a short time.
Advantages:
Fast operational speed, able to complete distribution quickly.
Market reaction time is short, not easily causing excessive fluctuations.
Disadvantages:
Easily triggers market panic selling, leading to a sharp decline in stock prices.
Requires strong market control and capital allocation capabilities.
Directed Distribution MethodDefinition: The main force distributes chips to specific targets through directed bulk transactions or agreement transfers.
Operation Steps:
The main force negotiates with institutions or large holders to conduct bulk transactions at agreed prices and quantities.
By releasing market news, attract the attention and buying of specific targets.
Advantages:
Transparent transactions, avoiding market fluctuations.
Can complete large-scale distribution at higher price levels.
Disadvantages:
Requires finding large funds willing to take over.
May be detected by the market, thus affecting stock price trends.
Thus, a main force's profit cycle is completed, and this process can be repeated continuously. This is also why people often say that the market has cycles, with a price trend resembling the four seasons of spring, summer, autumn, and winter, continuously repeating.
By thinking in the mindset of the main force, one can easily understand the danger signals that are hard for retail investors to notice. When all indicators are consistent, and all news aligns, it is the most suitable time to cut losses for the retail investors. The more favorable the news, the more it represents distribution; the more unfavorable the news, the more it represents absorption.
Questions about the Wyckoff Trading Method
The Wyckoff Trading Method is a clear and well-defined trading approach for each stage.
For technical analysis traders, adding volume-price analysis to their trading system can significantly improve their trading win rate.
The definitions and interpretations of each stage in the Wyckoff Trading Method can help traders get closer to the essence of the market, understand market cycles and supply-demand relationships, and clarify which stage of the cycle they are currently in, thus formulating corresponding trading strategies.
The principle of causality and the coordination of effort and results can also help us better understand the changes in price charts and K-lines. However, the Wyckoff Trading Method also has clear drawbacks. Because this method requires traders to possess strong analytical skills, and everyone's understanding of causality as well as effort and results varies, it is a relatively subjective trading approach.
The Wyckoff Trading Method itself is a set of objective methods, but it has high requirements for the user's abilities, making the analytical process relatively subjective. It is like watching Sherlock Holmes or Conan, where the detective's reasoning process is very objective: finding clues, making bold hypotheses, cautiously verifying, and then using the process of elimination to rule out all impossible options to find the truth. However, this process is very subjective, as it requires the detective to make deductions based on their rich knowledge and accumulated experience. Each detective's observation skills and background knowledge differ, so even using the same method, Conan can deduce who the murderer is, while Mouri Kogoro can only get stabbed from behind and fall.
Finally, it should be noted that Wyckoff's buying operations require at least a weekly time frame, making it difficult to apply to short-term trading. Many retail investors lack patience and always hope to double their investments the day after buying.
The advice for retail investors is to first cultivate patience and discipline, understanding that investing is a long-term process, not a shortcut to overnight wealth. Secondly, formulate a reasonable trading plan and strictly implement it to avoid emotional trading. Diversifying investments, setting stop-loss and take-profit strategies can effectively reduce risks. Continuously learning and improving trading skills, accumulating experience, is essential for steady progress in the market. The most important thing is to have clear goals and reasonable expectations, not to be disturbed by short-term fluctuations, and to stick to one's investment beliefs.
If you are also a technical enthusiast studying technical operations in the cryptocurrency market, you may want to follow @钱包守护者 , as you will gain more insights!