Hello Traders 🐺
In this idea I want to use one of my favorite trading tools to identify the support levels for BTC.D — and as you probably guessed, it's the EMA Ribbon!
As you might know, EMA Ribbon is one of the best types of EMA indicators you can use, because it gives you a wide range of dynamic support and resistance based on exponential moving averages. Most importantly, when you apply it on higher timeframes like the weekly or monthly chart, it becomes incredibly accurate.
In the BTC.D chart, we now have two points of confluence meeting each other:
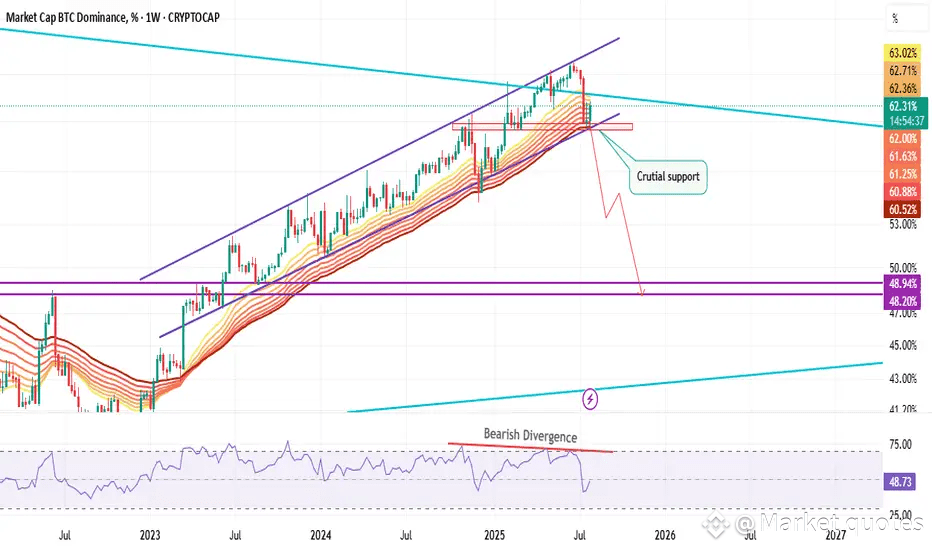
the red weekly support box
the last strand of our dynamic support, which is the EMA Ribbon
But what now?
Well, considering the bearish divergence on the weekly chart, the overbought zone on RSI in the monthly timeframe, and the current setup in altcoin charts, I think we can say — with a high degree of certainty — that BTC.D is on the verge of a collapse...
Make sure to act accordingly — and as always, remember our golden rule:
🐺 Discipline is rarely enjoyable, but almost always profitable. 🐺