This is an idea I've had for a while (unpublished) but looking at local structure, I have to revive this..
It's a very rare expanding triangle idea as the Y wave of the macro WXY wave.
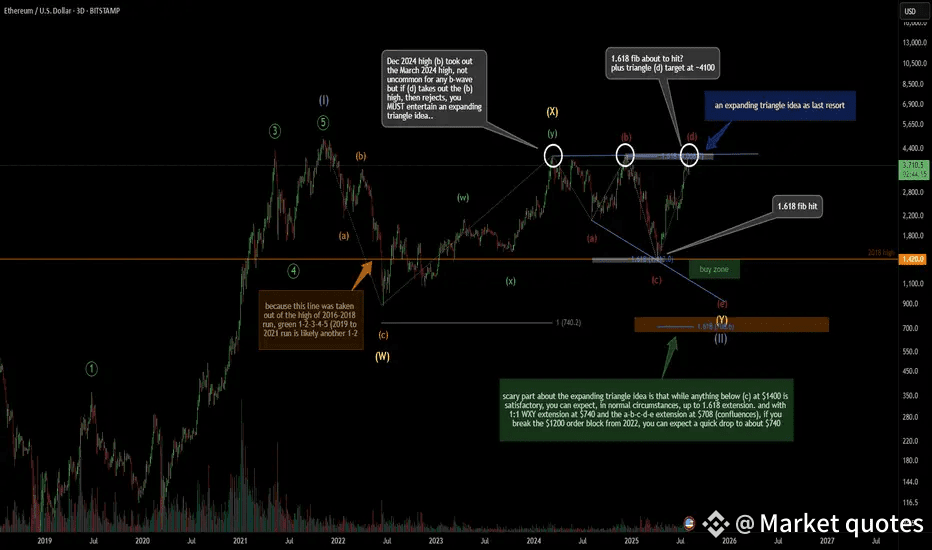
The December 2024 high took out the March 2024 high. And, it's not uncommon, especially in crypto, for B/W wave to take out the previous high (i.e. overshoot). But, considering that the pink a-b-c-d-e's April 2024 low (c) hit the exact 1.618 extension, and the high likelihood of (d) about to hit 4k+ and overshoot the December high of 2024, there is a likelihood that you're seeing an expanding triangle play out.
If you see a rejection at previous December 2024 high (i.e. a swing failure pattern), you must entertain the idea of expanding triangle at the very least.
The unfortunate part is, if this is true, the (e) wave has a huge range, from ~$1400 to $700. The minimum requirement of (e) is to take out the (c) low but can extend to 1.618 at $700.
Will have to see the local structure playout once we get close to (c) or below.
More evidence for expanding triangle is the volume and the open-interest. From March 2024, volume has been steadily increasing (not visible on Bitstamp chart here, but go look at Binance Ethereum chart, for example) and open-interest has been increasing since March 2024, all the while price has kept peaking at ~$4k. For bulls, this should be very concerning as it means the kettle's been boiling hotter and hotter and the pressure's been building up - and long-to-short ratio is still very much positive. A swing failure pattern at (d) and with late longs entering in the market at the peak, it's possible a cascade of liquidation could result in a quick move down to (e).