The market conditions are markedly different from what we saw at the start of the bull market.

Shiba Inu (SHIB) has recently seen a sharp price drop. After what seemed like a textbook rebound, SHIB encountered a disastrous defeat at the resistance level of $0.0000125, which was previously considered a key short-term breakout point. The frustration at this level exposed its vulnerability in the current market environment and erased several days of cautious gains.
The bullish reversal that could have appeared on the daily chart was completely destroyed by resistance almost exactly at the 50-day moving average. SHIB's current trading price is approximately $0.0000121, down nearly 3% on the day, with market momentum almost completely dissipated. SHIB has just broken through the local support level of $0.0000118, attempting to retest the important moving averages from below, even showing signs of increasing buying pressure—this makes the technical situation that led to this breakdown particularly unfavorable.
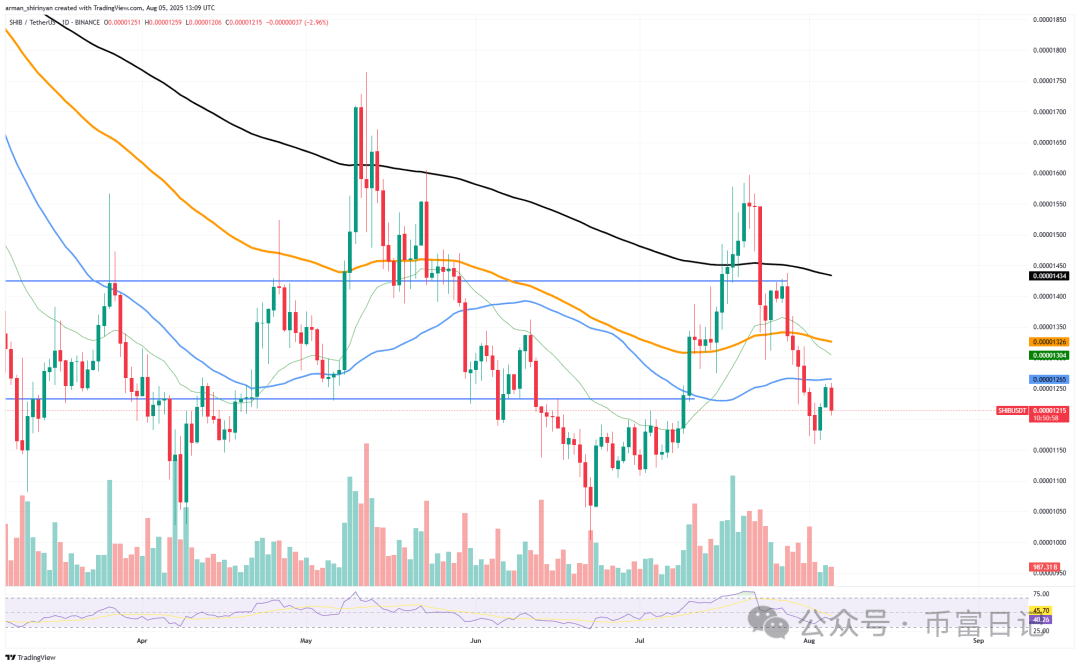
When the trading volume plummets again, it confirms the price decline, indicating that the pressure is insufficient to overcome multiple layers of resistance. The most likely outcome in the short term is a range consolidation between $0.0000114 and $0.0000122. The RSI has fallen to 45, indicating that there is currently no overbought pressure and no strong force supporting buyers.
If SHIB cannot hold the support level at $0.0000114, then the $0.0000105 area (the starting point of the recent significant fluctuation) may be the next resistance level. Conversely, SHIB needs to break through $0.0000126 significantly (preferably with increased trading volume) to regain upward momentum.
Ethereum declines
Ethereum's recent drop from the $3700 mark is undoubtedly unexpected, but the situation is not as bad as it seems. After experiencing a strong rebound of over 35% within a few weeks, the asset encountered resistance near the $3,700 mark. Today's candlestick chart shows that Ethereum has again fallen more than 2%, with the current price approaching $3640. This drop has formed a short-term downward trend line.
From a technical perspective, this is undoubtedly a pullback. Fortunately, there is currently no actual bearish trading volume supporting it. During this pullback, the trading volume has continued to decline, and the bearish candle formed today is due to the low trading volume. This is crucial because a surge in volume—usually seen in strong bearish reversals—has not occurred at this time.
In addition, the ETH price is cooling down but has not entered the oversold area, indicating weak selling pressure, with the RSI remaining above 57. Due to the low trading volume, this decline appears to be a healthy cooling off rather than a trend reversal. If buyers step in near the 20-day moving average (around $3,600), especially as the overall market stabilizes, ETH's price could rise rapidly.
The subsequent upward momentum is likely to push ETH to test $3,700 again, and if ETH can break through the downward resistance line, the momentum will further strengthen. The 50-day and 100-day EMAs are at levels of $3,300 and $3,100 respectively; if the 20-day EMA loses support, market attention will shift to these levels.
Dogecoin is ready
Based on Dogecoin's price trend, it is urgent to break below $0.20. Since reaching a high of about $0.29 in mid-July, Doge
Dogecoin has been steadily declining. The 50-day exponential moving average and the 200-day exponential moving average converge around $0.213, and the recent pullback has formed a resistance level that Dogecoin cannot break through.
Today's 3% drop confirms the market's unwillingness to support Dogecoin at such high levels. It's clear on the chart: declining volume, lower highs, and weakening RSI momentum (currently at 51), all indicate that Dogecoin is in a predicament. It's not just technical noise; breaking below $0.20 would signal a breach of the short-term support level and turn the psychological round number into a resistance level.
The next support level is at $0.19 (100-day moving average), and if Dogecoin decisively drops below $0.20, a stronger demand area will be around $0.175. Given the lack of volume support for Dogecoin's rebound attempts, the likelihood of entering this area is high.
If Dogecoin drops below $0.20 and closes below that price on the daily chart, it is best to wait for confirmation of a bottom formation before re-entering. Traders should wait for the RSI indicator to drop into the oversold area and show a rebound or reversal candlestick confirmation before taking action. This market structure lacks the hype that Dogecoin has shown, which could lead to a sharp decline. Until market sentiment changes or trading volume surges to provide support, expecting continued declines is more realistic.
