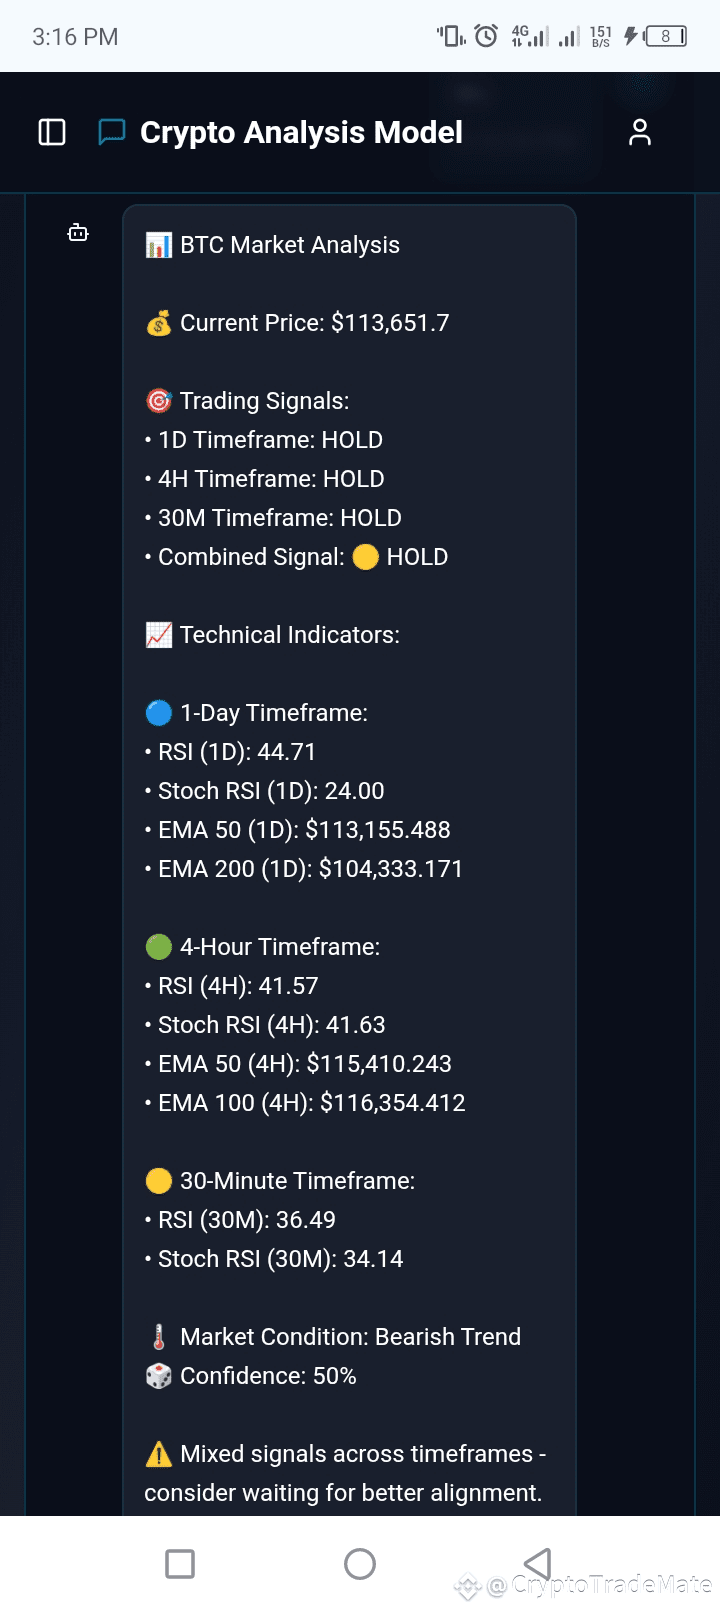
Fellow traders, let's conduct a detailed breakdown of Bitcoin's current market status. As of the latest snapshot, BTC's price stands at $113,651.7. Our Crypto Analysis Model has a clear message for us today: exercise caution.
A quick look at the trading signals across different timeframes reveals a consistent pattern of indecision:
1D Timeframe: HOLD
4H Timeframe: HOLD
30M Timeframe: HOLD
Combined Signal: HOLD
This unanimous "HOLD" signal is a powerful indicator that the market lacks a strong directional conviction. It suggests that both bulls and bears are currently at a standstill, creating a volatile and uncertain environment.
Let's dive into the technical indicators to understand the underlying mechanics of this holding pattern.
1-Day Timeframe:
RSI (1D): 44.71 - A very neutral reading, confirming the lack of significant momentum in either direction.
Stoch RSI (1D): 24.00 - This is an interesting signal. It's pushing towards oversold territory, suggesting that a potential bounce could be on the horizon. However, without a corresponding buy signal, it's more of a warning to watch for a shift in momentum rather than a reason to enter a trade.
EMA 50 (1D): $113,155.488 - The price is currently trading just above the 50-day EMA. This is a critical level. A sustained break below this could signal further downside, while holding above it could provide some support.
EMA 200 (1D): $104,333.171 - This long-term moving average remains far below the current price, indicating that the long-term trend is still bullish, despite the recent sideways movement.
4-Hour Timeframe:
RSI (4H): 41.57 - Another neutral reading, reinforcing the HOLD signal.
Stoch RSI (4H): 41.63 - Also in a neutral zone, not giving any strong clues about the short-term direction.
EMA 50 (4H): $115,410.243 - The current price is trading below the 50-period EMA on the 4-hour chart. This is a bearish sign in the shorter timeframe, indicating that momentum has shifted to the downside.
EMA 100 (4H): $116,354.412 - The price is also below this key moving average, adding more weight to the short-term bearish outlook.
30-Minute Timeframe:
RSI (30M): 36.49
Stoch RSI (30M): 34.14 - Both indicators are neutral, showing no immediate signs of a breakout in either direction.
Overall Market Condition: Bearish Trend
Confidence: 50%
The model's overall assessment is a Bearish Trend with a 50% confidence level. This moderate confidence rating is a reflection of the conflicting signals—long-term is bullish, but short-term is showing signs of weakness and consolidation.
Analyst's Take:
The most important takeaway here is the mixed signals across all timeframes. The model is literally advising us to "consider waiting for better alignment." This is not a time to be making big, high-risk moves. The market is waiting for a catalyst, and until then, it could go either way.
My recommendation is to remain patient. Avoid entering new long or short positions with significant capital. If you are already in a long position, be vigilant and consider tightening your stop-losses. The price trading below the 4-hour EMAs is a warning sign that the path of least resistance in the short term might be to the downside.
Watch for a definitive break above the 4H EMAs or a decisive move below the 1D EMA 50 to confirm the next major direction. Until then, protecting your capital is the smartest play.