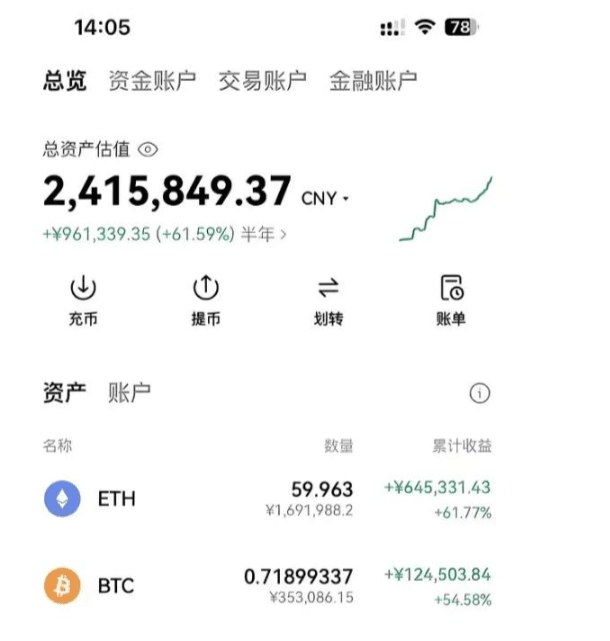
Yes, whether it’s becoming wealthy or going bankrupt after a liquidation, this has changed their fate. I never thought that in just a few years, my life would undergo earth-shattering changes due to digital currency.
In 2017, with a trial-and-error mindset, I bought my first Bitcoin with 1000 RMB. At that time, the price of Bitcoin was still hovering around a few thousand yuan, and I didn't even expect it to rise much. However, within just a few months, the price of Bitcoin skyrocketed, and my 1000 RMB turned into tens of thousands.
After tasting the sweetness, I began to study blockchain+ and digital currencies in depth, and gradually invested in mainstream coins like Ethereum+ and Litecoin+. I learned how to read candlestick charts, analyze market trends, and even participated in some early-stage project private placements.
In 2018, the crypto market experienced a bull market, and my assets rose dramatically. I seized the opportunity and decisively invested some digital currency to buy my first house in the city center.
The energy market in 2019 caused me significant losses, but I did not give up; instead, I chose to continue learning and accumulating knowledge. I firmly believe that blockchain technology is a future trend, and the value of digital currencies will eventually return.
In 2020, the rise of DeFi (Decentralized Finance) reignited enthusiasm in the crypto sphere. I keenly captured this trend and actively participated in liquidity mining and staking, reaping substantial rewards.
Now, I have achieved financial freedom, but I still maintain my love and exploration of blockchain technology. I know that the crypto space is full of opportunities but also harbors risks.
Learning is fundamental: Understanding blockchain technology, the principles of digital currency, and market trends is a prerequisite for investment. Only by continuously learning and maintaining rationality can one navigate the turbulent sea of cryptocurrencies.
Methods for selecting hundredfold coins.
1. The circulating market capitalization and total market capitalization should be low. The total market capitalization of public chains is best below 50 million, and DApp protocols should be below 5 million. The circulating market capitalization should be low because if the market capitalization is too high, there won't be enough upward space, so the lower, the better. Why must the total market capitalization be low? Because the tokens will gradually be released in the next 1-2 years. If the total market capitalization is too high, it means that the project party (whales) doesn't need to pump the price; they can simply sell and become wealthy. Or if it drops 10 times, there is still a high price and profit.
2. The ceiling of the track should be high. At least in a bull market, the valuation should reach over 1 billion USD. If it's a meme coin, you can refer to Dogecoin; if it's a public chain, you can refer to ETH, SOL, MATIC; if it's a DApp or protocol, you can refer to UNI, AAVE, LDO, etc.
3. New narratives; do not participate in too obscure tracks. It’s best to solve practical problems. New narratives must be long-term value discoveries, not short-term speculative hype. For example, the current AI GPU computing narrative, safer, faster, and more decentralized public chains, and the infrastructure of cross-metaverse games and AR.
4. A hundredfold dark horse market must be in an overlooked area. Because coins known to the entire network are basically high-opening (ICP) or have normal valuations (ARB), do you think their unit price can rise a hundredfold? At the time of opening, the total market capitalization is several hundred billion or several trillion. Not to mention a hundredfold increase; even a tenfold increase would match ETH and BTC.
5. Early hundredfold coins generally have very poor liquidity, usually on-chain or on small exchanges. So many beginners, when seeing others recommend early coins, do not study their value, constantly saying that they don't want to go to small exchanges, as they seem too much like garbage coins, and purchasing is too troublesome; they don't even participate because there is no app. These are all surface phenomena, failing to see the essence of value. When I bought magic in 2021, cross-chain was very troublesome; later it surged 10 times in a month. In February 2023, I also needed dual wallets for cross-chain when I bought PPI; I tried many exchanges that did not support it, and later Gate supported Espace withdrawals. Later on, BRC20 tokens also had a high threshold; they required points and OTC, which was very troublesome. In short, high thresholds are a necessary path for non-experts, while no threshold exists, but it's hard to make money on it; they are all selling off after going online. Refer to the recent trends of RDNT GNS PEPE FLOKI.
6. The best time for token launch is either at the peak of a bull market or at the beginning of a bear market. When researching or buying, the best time for listing and washing is 6-12 months, and the circulation rate should preferably be above 50%. KAS was launched in May 2022 and underwent deep washing for about six months, with its highest increase this year being over 100 times. PPI was also launched in May 2022, starting to surge after a deep wash of about nine months, with its current circulation rate being around 60% and its highest increase this year being about 50 times.
7. Low unit price, with many zeros after the decimal point. If the unit price suddenly jumps to several hundred U or several thousand U, it will scare away more than 80% of retail investors. Especially in a bull market, new retail investors rush in without understanding market value, meme coins, and public chain coins often start with very low unit prices, 3-5 zeros are normal.
8. It's best to be on public chains or leading protocols on public chains. The best way to make money in the crypto space is through public chains. In the bull market of 2021, more than ten hundredfold public chain coins emerged, such as SOL, MATIC, AVAX, SOLFTM, each with its own advantages. Many leading protocols also emerged, such as UNI, AAVE, CAKE, XVS, etc. Why didn't I participate in Hong Kong hotspot coins like ACH and LINA? Because they are not public chains, many things have a short lifecycle, and they end after a wave of speculation. However, public chains are different; they are always hot and continually work on ecosystems and market capitalization.
9. The founder, team background, investment institutions, and financing amounts must be reliable. The founder should preferably be a known figure in the crypto space, such as a core member of the Ethereum team or, for example, Y God for KAS, and Professor Song for ROSE. Having well-known institutions participate in investments is equivalent to gaining an endorsement. The financing amount and project valuation are also very important; good public chain projects typically have high valuations in the billions.
10. Do not participate in violations of value investment logic. What does it mean to violate the logic of value investment? For example, calculating a stable AMPL, and a deflationary token on Arbitrum that becomes scarcer the more you hold it. Whenever you see this kind of situation, regardless of how innovative it is, do not participate. In the end, it will definitely end up in a mess, and you will suffer immensely. AMPL cut off many big influencers. If you think you are a natural fast runner, then just ignore what I said.
11. Try not to participate in old coins unless there is a very strong new narrative. For example, this round of RNDR and CFX are both old coins, but their narratives are very good, perfectly fitting the main theme of this new bull market. The former spans several hot sectors such as AI, GPU, NFT, chain games, AR, VR, and basic setups are difficult to eliminate. The latter is a better, faster, and safer public chain, with support from national government resources, plus Hong Kong is set to become the core of the new WEB3.0 wave, making CFX a central target in Hong Kong's hotspots. Without discussing this Hong Kong hotspot, it is also a relatively good public chain, with its own ecosystem and value.
12. Choose leading tracks and try not to choose the ones behind. In the Hong Kong hotspot, I chose CFX, and the ecosystem coin I chose is the Dex token PPI. The ecosystem coins on CFX are all incubated on PPI, so it is the leading ecosystem coin.
If you carefully read the above 12 points, you should understand that you don’t need to look at all the coins mentioned above anymore, as they have already passed their market phases, and the probability of a second wave of hundredfold trends is very low, even the probability of a tenfold trend is also very low. What you need to do is to filter out new market varieties through these 12 iron rules.
Six key techniques to capture hundredfold coins
In the world of cryptocurrencies, investors are eager to capture those potentially explosive hundredfold coins for rapid wealth growth. However, accurately identifying true hundredfold coins among numerous projects is not easy. However, by mastering the following six key techniques, you will enhance your ability to identify and are more likely to seize the opportunity for wealth.
Technique one: Pay attention to holding costs. When you believe a particular coin has the potential for a hundredfold increase, be sure to consider your holding cost. Enter decisively at the right moment, especially after the market experiences a black swan event, acquiring more chips at a lower cost so that when the project rises in the future, you will have a larger profit margin.
Technique two: Choosing tracks with higher certainty is also very critical. Pay attention to those hot tracks, public chain ecosystems, and coins that had significant pullbacks in the previous round but are indeed valuable. These tracks often have higher market attention and capital inflows, providing a good environment for the birth of hundredfold coins.
Technique three: Learning to value projects is also one of the important methods for judging hundredfold coins. You need to independently value projects, compare the pros and cons of similar projects, and weigh their valuations against current circulating market values, which will help you more accurately judge whether a project's value is underestimated, thus finding potential hundredfold coins.
Technique four: Understanding project backgrounds is also crucial. A successful hundredfold coin project usually has a strong background, including powerful team technical strength, rich project resources, and partners. These background factors play a vital role in the development of the project and are an important guarantee for crossing the hundredfold threshold.
Technique five: Learning to read white papers is also an important way to discover hundredfold coins. The white paper represents the pattern and development direction of a project. By carefully reading the white paper, you can gain in-depth understanding of the actual problems the project aims to solve, as well as its underlying logic and technical architecture. This will help you comprehensively understand the project and discover potential hundredfold coin opportunities.
Technique six: Controlling the market direction is also crucial. The emergence of a hundredfold coin often occurs under specific market conditions. Therefore, you need to closely monitor market developments, including current market hotspots, capital flows, and policy changes. By mastering market direction, you will be able to more accurately judge which projects may become the next hundredfold coins, thus seizing opportunities for wealth.
If you master this set of methods, trading coins with it can guarantee your account to multiply 30 times. Today, I have specially organized the essentials to share with those who are destined to encounter them; make sure to keep it well.
I believe many traders have heard of the Wyckoff Method and Wyckoff trend analysis. This article will take you to systematically understand the core concepts of Wyckoff theory and share how to incorporate them into practical trading techniques.
Introduction to Wyckoff basics
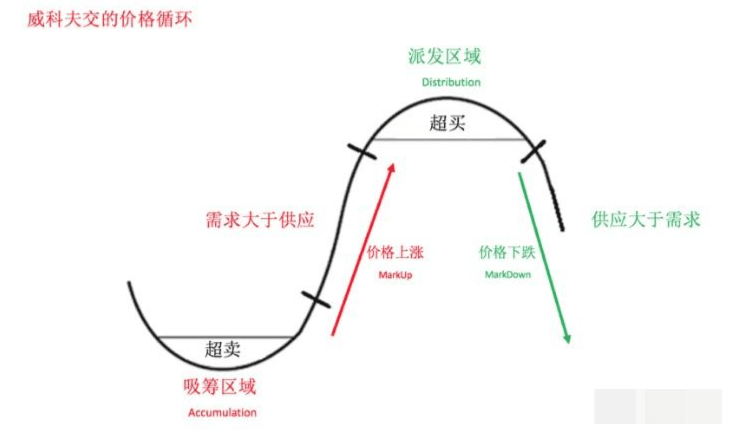
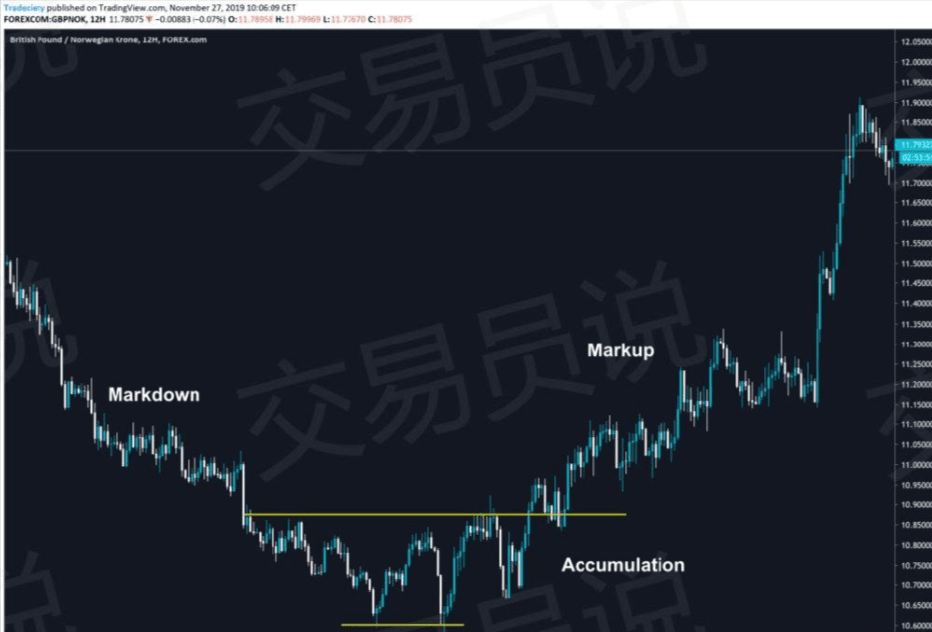
The core of the Wyckoff Method lies in the classification of market trend phases, as illustrated below.
@Downward trend
Accumulation phase
This is the stage where the downward trend stagnates, and the price enters a horizontal consolidation phase. At this point, it is still impossible to confirm whether the downward trend has truly ended.
Spring effect
When the price fails to break through the support level, it indicates that the downward trend is difficult to sustain. At this point, traders can basically determine that the original downward trend is about to reverse.
Upward phase (Markup)
Once the price breaks through the accumulation zone, a new upward trend officially begins.
Distribution phase
With the weakening upward momentum, the price enters the distribution zone, early bulls begin to take profits, and 'large funds' quietly position themselves in preparation for the next trend.
Spring effect
When the price reaches a new high in the range, this is an excellent opportunity to add to short positions. If large funds are preparing to initiate a downward trend, high-level distributions can achieve the best price. Many traders often set their stop-loss orders above the range. This kind of false breakout is both a means of hunting stop-losses and a typical trap for enticing long/short positions.
Downward phase (Markdown)……
Of course, not all markets will strictly follow this pattern, but once you master this method, it will become increasingly easier for you to recognize these recurring rules.
In the following text, we will analyze the practical application scenarios of Wyckoff theory through specific chart examples.
Institutional trading behaviors
The most critical participants in the market are so-called 'large funds.' These big players include central banks, hedge funds, commercial banks, and government agencies. They are the true forces driving the market.
These market participants cannot establish positions all at once and need to complete their accumulation through gradual layout. This process usually occurs during the accumulation and distribution phases: they need to first cautiously flatten their existing positions before slowly building new ones. For these institutions, it is crucial to avoid the price prematurely leaving the target range before completing the full accumulation.
For retail traders, a wise approach is to avoid participating in the horizontal oscillation of accumulation and distribution phases and patiently wait for breakout signals or retracement opportunities.
Retail traders often excessively chase prices, usually entering trends too late. Since most trading articles promote 'trend following' as an 'easy way to profit,' ordinary traders always wait for the trend to become clear before taking action. However, a more efficient strategy is to enter the trend near large capital accumulation areas.
This is precisely why we always insist on and teach breakthrough trading and retracement trading strategies. Traditional trend-following methods often yield poor results.
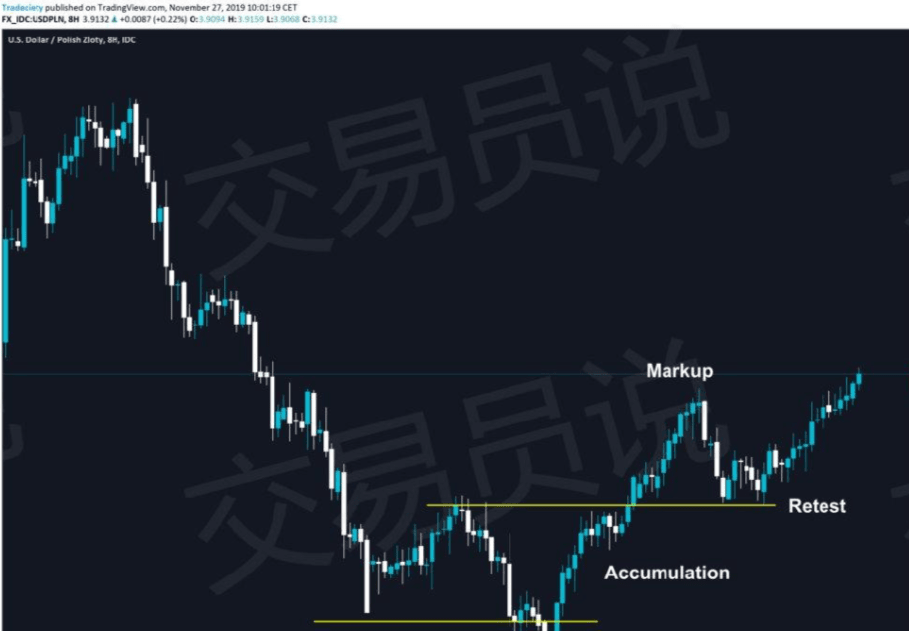
Wyckoff Learning #1: Retest
When I study trading concepts or share my strategies, I primarily focus on non-textbook forms. Price movements rarely develop perfectly according to textbook patterns, so being exposed to various different chart cases will be very helpful for practical trading.
The screenshot below shows a perfect downward accumulation - short-squeeze rebound (Spring) pattern.
At the bottom, the price briefly broke below the previous low but did not continue the downward trend. Notice that the bearish candlestick during this potential 'false breakdown' is very small and lacks persuasion, while the subsequent bullish candlestick is stronger and has a longer body. This already suggests that this breakdown attempt is very weak.
Subsequently, the price broke through and rose for a period of time before beginning to retrace. Many traders enter the market at the breakout and move their stop-loss to the breakeven point. This behavior is so common in the market that we often see retests occurring, and this retest precisely hits back to the previous breakout level, triggering all stop-loss orders while also providing an opportunity to buy again at a lower price.
Price behavior before the breakout
This analysis may be a bit off-topic, but it's definitely worth a look. Before the price truly breaks through the accumulation/distribution zone, a special retracement structure often forms, which I call 'Lower-Bounce'.
Ask yourself again, what kind of bull and bear forces does this reveal:
In the oscillation range, the bears have significantly pushed the price down to the support level (as seen from the large bearish candlestick). Then the bulls attempted to intervene and push the price higher but failed, and the price didn't even approach the previous high. This is a very critical signal indicating that the market is still dominated by bears, and hence, the subsequent bearish breakout is a logical result.
You will find that this pattern often appears before many successful breakouts, so you might want to consider this 'lower-level rebound' as a resonance factor in your trading considerations.
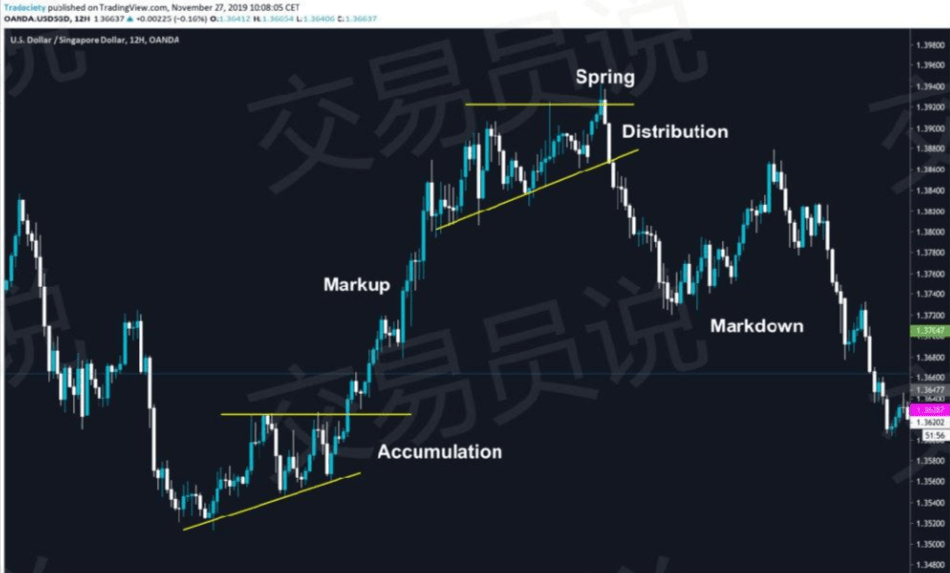
Wyckoff Learning #2: Confirmation
Sometimes, the 'spring effect' can appear in the form of a single pin bar. The key point is: this 'bounce' must break below the previous low to fully confirm that this is a failed breakout attempt.
As shown in the figure below, the accumulation phase forms within a clearly defined horizontal range, with horizontal resistance levels. Before the formal breakout, the price has started to build higher lows, which is a very important bullish resonance signal, especially when it appears after the spring effect, further indicating that buying pressure is accumulating.
In this case, the retest appears immediately, revealing once again why the 'capital preservation stop-loss' strategy is not the best choice. Although traders believe such stop-losses can 'protect' their positions, in most cases, they actually make holdings vulnerable during price retracements.
Once the retracement is confirmed, the price immediately enters the upward phase.
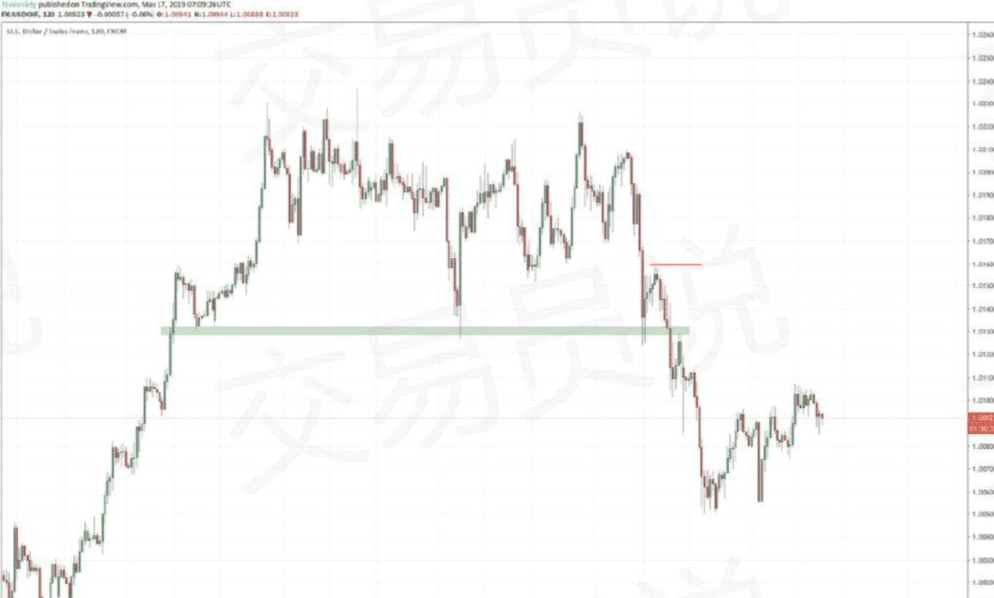
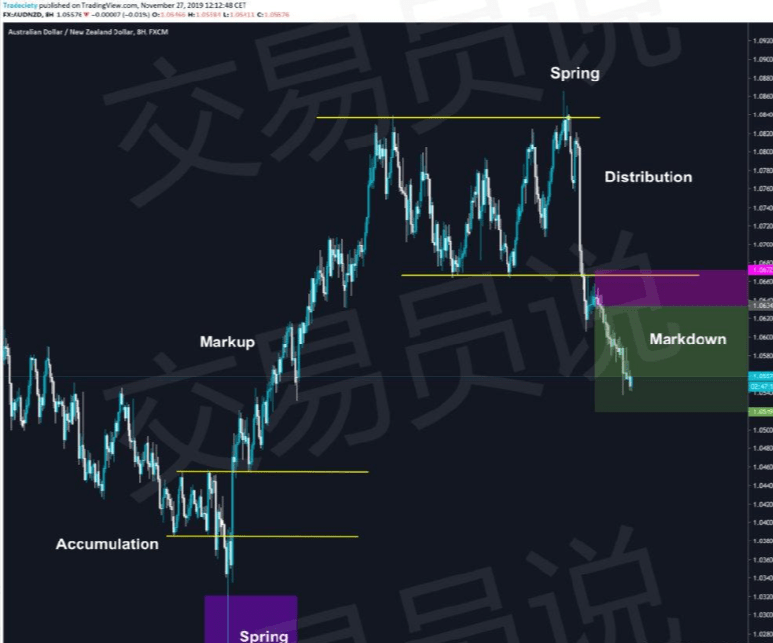
Wyckoff Learning #3: Non-textbook-style accumulation and distribution
Let's continue exploring those non-textbook-style accumulation and distribution phases.
In the left side of the image below, the price did not form a long-term horizontal accumulation area, but we can clearly observe that the price stagnated after a downward trend. Furthermore, before the accumulation began, the price did not show a significant strong downward trend, but rather a slow decline. This already hints that this round of downward trend is not strong. If a reversal occurs after a relatively weak downward trend, then the new upward trend is usually stronger.
The spring shape is also very strong, further indicating that the market forces are about to change. After the failure of the downward breakthrough, a very strong bullish candlestick appeared.
So far, we have found multiple resonance signals indicating that an upcoming bullish trend may succeed. It is very important to trade confidently using such a system, and layering these resonance factors strengthens trade confidence. The more hints we can find, the stronger our confidence in trading.
After the breakout, the market immediately retraced and formed a retest pattern. This is a very important market pattern that is well worth studying in depth.
In the right image, you can see a trade I still hold (this trade had reached the profit target when this article was published). I traded based on the breakout from the distribution zone. This 'bounce' is represented by a pin bar candlestick that broke all previous highs. This distribution zone is defined by a very clear horizontal support level. Compared to trend lines, horizontal support levels involve less subjective judgment, making it easier to grasp the timing of trades.
This breakout also comes with a retest.
Wyckoff Learning #4: Wyckoff and divergence signals.
Divergence is an excellent trading analysis tool that perfectly fits with Wyckoff theory and trend analysis. Although I have discussed divergence multiple times, in brief, divergence phenomena indicate that the current trend's momentum is waning.
As we have seen in the previous few chart studies, the core of Wyckoff trend analysis is precisely interpreting trend structures and trend strengths.
In the following scenarios, the distribution phase occurs when the RSI indicator shows divergence. Although this distribution is not a perfect horizontal consolidation pattern, we can clearly see that the upward trend is losing momentum. The trend segments are getting shorter, and the price struggles to reach new highs. At the top, the spring shape manifests as a failed breakout, followed by a rapid downward reversal.
After the spring, the bearish candlestick suddenly became strong and obviously elongated, further confirming the shift in long and short forces. The bears are clearly ready to take over the market.
The downward phase (Markdown) did not achieve success immediately, but the price retracted back to the breakout area.
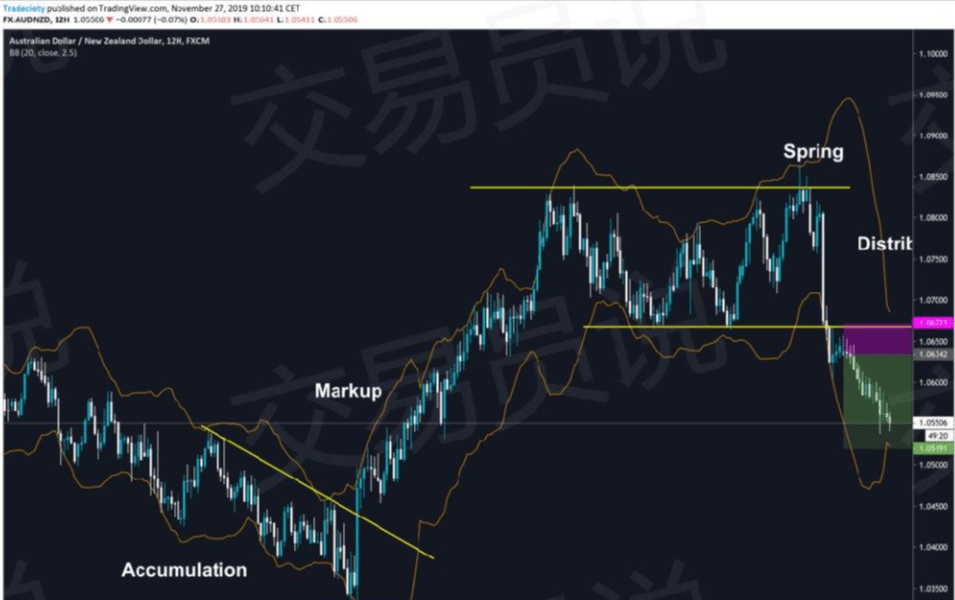
Wyckoff Learning #5: The synergy of spring shapes and Bollinger Bands.
When identifying important spring shapes, Bollinger Bands are a perfect tool. Bollinger Bands essentially measure price volatility through the standard deviation indicator, which means that when the price breaks through the outer Bollinger Band, it often indicates a significant market event. 95% to 99% of price fluctuations occur within the Bollinger Band channel.
If the price can significantly break through the outer Bollinger Band, it will be even more meaningful. When the price crosses the outer Bollinger Band significantly, it should particularly catch your attention. In the example below, the 'bounce' on the left shows a very strong spike breaking through the outer Bollinger Band. We have discussed this chart situation earlier, but when combined with Bollinger Bands, we can treat it as another resonance factor in our toolbox.
The stronger the breakout amplitude (peak), the higher the likelihood of actual trend reversal if all other resonance factors confirm the trend analysis.
Finally, I need to emphasize that relying solely on Wyckoff analysis in trading may not be the most accurate approach, but it provides a solid foundation for any chart analysis.
Summary
A carefully designed trading plan that seamlessly integrates the Wyckoff Method could be productive for the right trader. However, it is essential to remind less experienced traders that this is a very complex process that requires a lot of time to master.
Wyckoff's market theory is built on analyzing the market from the perspective of institutional investors. Traders must think about the ultimate goals of these institutions and how current market behaviors reflect their interests and actions.
Even today, many professional traders still use the Wyckoff Method. His stock selection and investment methods have stood the test of time mainly because they identify the foundational, systematic, and logical structures of high-probability, high-profit trades.
Wyckoff established some key principles in the early 20th century, such as trends, stop-losses, and profit-taking.
Even 100 years later, these eternal concepts continue to educate traders and investors.
In conclusion, the growth from beginner to expert indeed involves these four key progressive nodes, with each stage corresponding to different cognitive and skill improvements.
1. Gambler's mentality phase (introductory phase)
Core feature: Lack of understanding of the essence of things, making decisions based on intuition, emotions, or short-term interests, eager for quick profits, easily dominated by a mentality of luck.
Common manifestations: For example, blindly following trends when investing, entering the market without doing research; focusing only on returns while ignoring risks, hastily increasing investment to 'make up for losses' after incurring losses.
Key breakthrough: Realizing that 'luck is not sustainable' and starting to actively learn rules and methods.
2. Technical research phase (growth phase)
Core feature: Focused on learning professional knowledge and skills, attempting to improve success rates through 'techniques,' delving deeply into rules, tools, or methods.
Common manifestations: For example, traders frantically learn candlestick theories and indicator formulas; professionals are obsessed with various efficiency tools and process techniques.
Key breakthrough: Understanding that 'technology is not omnipotent' and starting to pay attention to variables outside of technology.
3. Risk control phase (mature phase)
Understanding how to calculate risk costs and establish defense mechanisms ensures long-term survival. Core feature: Shifting from 'pursuing wins' to 'avoiding losses.' Common manifestations: For example, investors set stop-loss lines and diversify their investments; project managers prepare emergency plans in advance to control trial-and-error costs. Key breakthrough: Understanding that 'survival takes precedence over high profits' and learning to maintain stability amid uncertainty.
4. Good mindset phase (expert phase)
Core feature: Able to manage emotions, accept uncertainty, respond to volatility with rationality and patience, and form a stable decision-making system. Common manifestations: Not being greedy in the face of profits, not anxious in the face of losses; not being disturbed by short-term results and sticking to long-term logic; essence: mindset is the accumulation of abilities from the first three stages and is the natural result of 'knowing and doing together'.
These four stages are not strictly separated but are a process of spiraling upwards — even experts can occasionally fall into a gambler's mentality; the key is to quickly perceive and return to rationality.
The above is a summary of my over eight years of practical experience and techniques in trading coins; it may not be applicable to everyone and requires each person to combine their own practice for use. As a trader, the most frightening thing is not having technical problems but lacking awareness and falling into these trading traps without realizing it! There is no invincible trading system; only invincible users of the trading system! This is the truth; trading systems ultimately return to the individual!
Even the most diligent fisherman would not go out to sea during the stormy season but would carefully guard his fishing boat. This season will eventually pass, and sunny days will always come! Follow me, and I will teach you both how to fish and the fishing itself. The door to the crypto space is always open; only by going with the flow can you have a flowing life. Save this and remember it!
I've traded everything you've traded, and I've also traded what you haven't. Every transaction is real and is a summary of practical experience, not derived from military strategy or tactics; it's not something learned from divine weapons, and no historical record is left! Follow (Awen Crypto) and welcome to exchange and learn together, fighting side by side!


