
There is currently a lot of discussion surrounding Ethereum's price: Can ETH break the $4,000 mark or is another collapse lurking? It seems that the bears are dominating this round. In the past 7 days, ETH has dropped over 2% and is currently trading around $3,681, still down 24.88% from its all-time high (ATH).
However, behind that surface picture, the data shows a completely different story – a scenario where 'smart money' may have set a trap. Three clear signals along with a bullish technical pattern suggest that Ethereum's recent declines could just be a cleverly staged bear trap.
Whales And Retail Investors Are All Optimistic
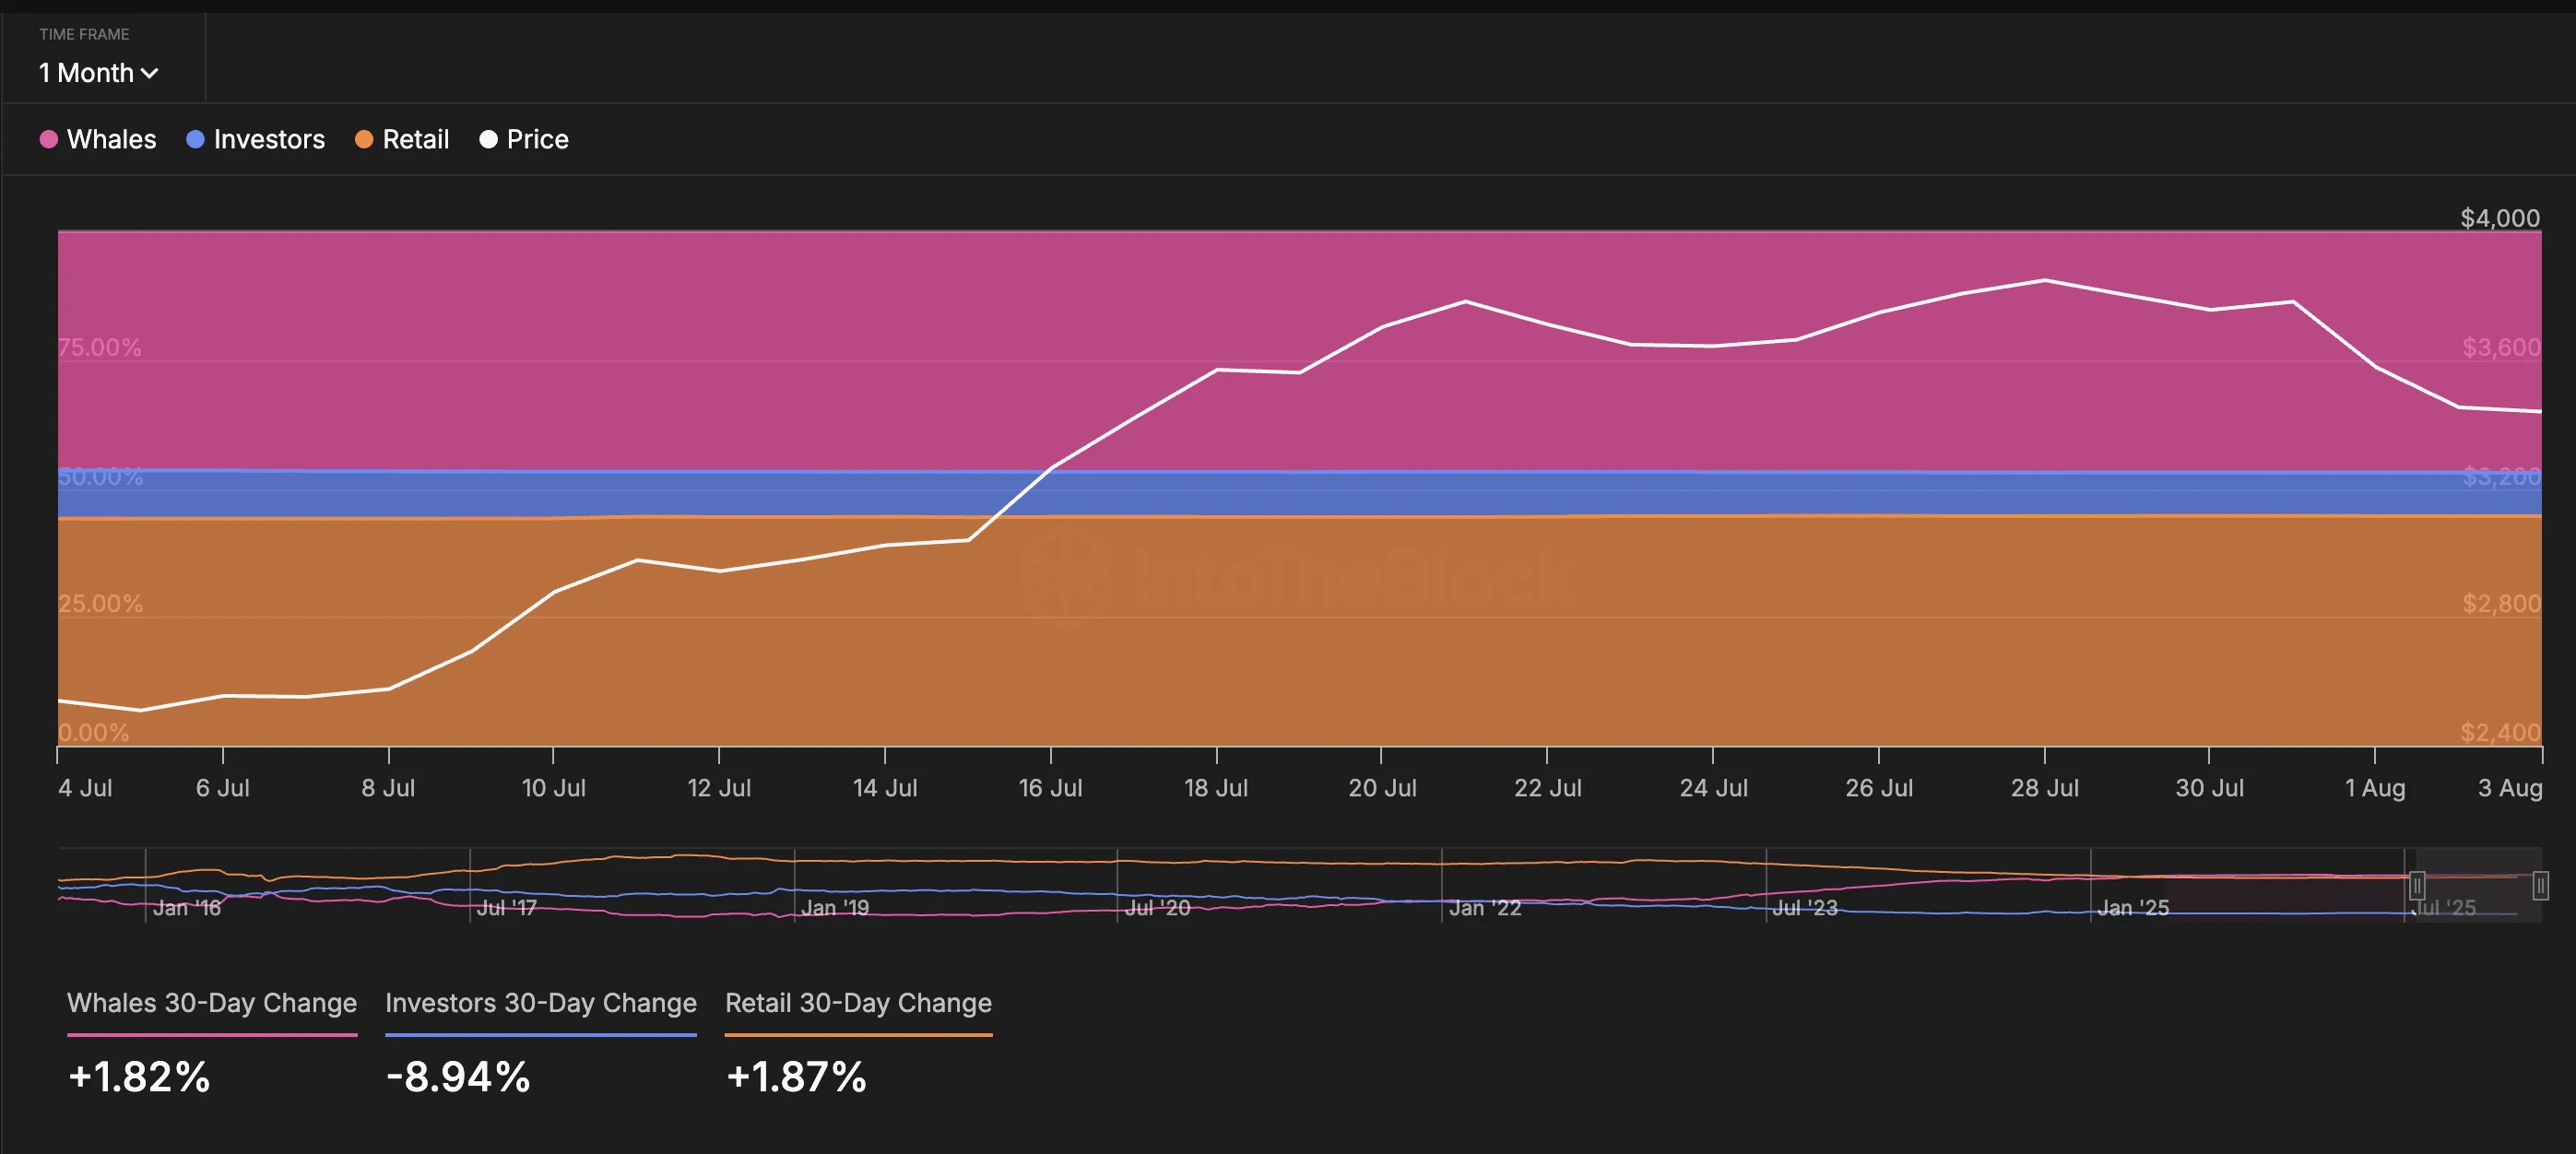
The first signal comes from Ethereum's on-chain allocation metrics. In the past 30 days, whale holdings have increased by 1.82%, while small wallets (retail holders) have also increased their accumulation by 1.87%. Typically, the moves of whales will have a greater impact compared to investors and smaller retail groups due to the superior transaction size.
And this time, it seems that retail investors are following in the footsteps of ETH whales – which could inadvertently trap mid-tier investors.
Interestingly, wallets belonging to mid-tier investors are offloading, indicating a potential redistribution of assets towards two extremes – whales and retail. These are two groups that usually have very different motivations, but this time, both seem to express confidence in ETH's growth prospects.
Further reinforcing the above viewpoint is the bull and bear address chart from IntoTheBlock, a tool that does not use traditional sentiment indicators. Instead, it tracks wallet behavior: bull addresses are those that have purchased more than 1% of the daily trading volume, while bear addresses are those that have sold at least 1%.
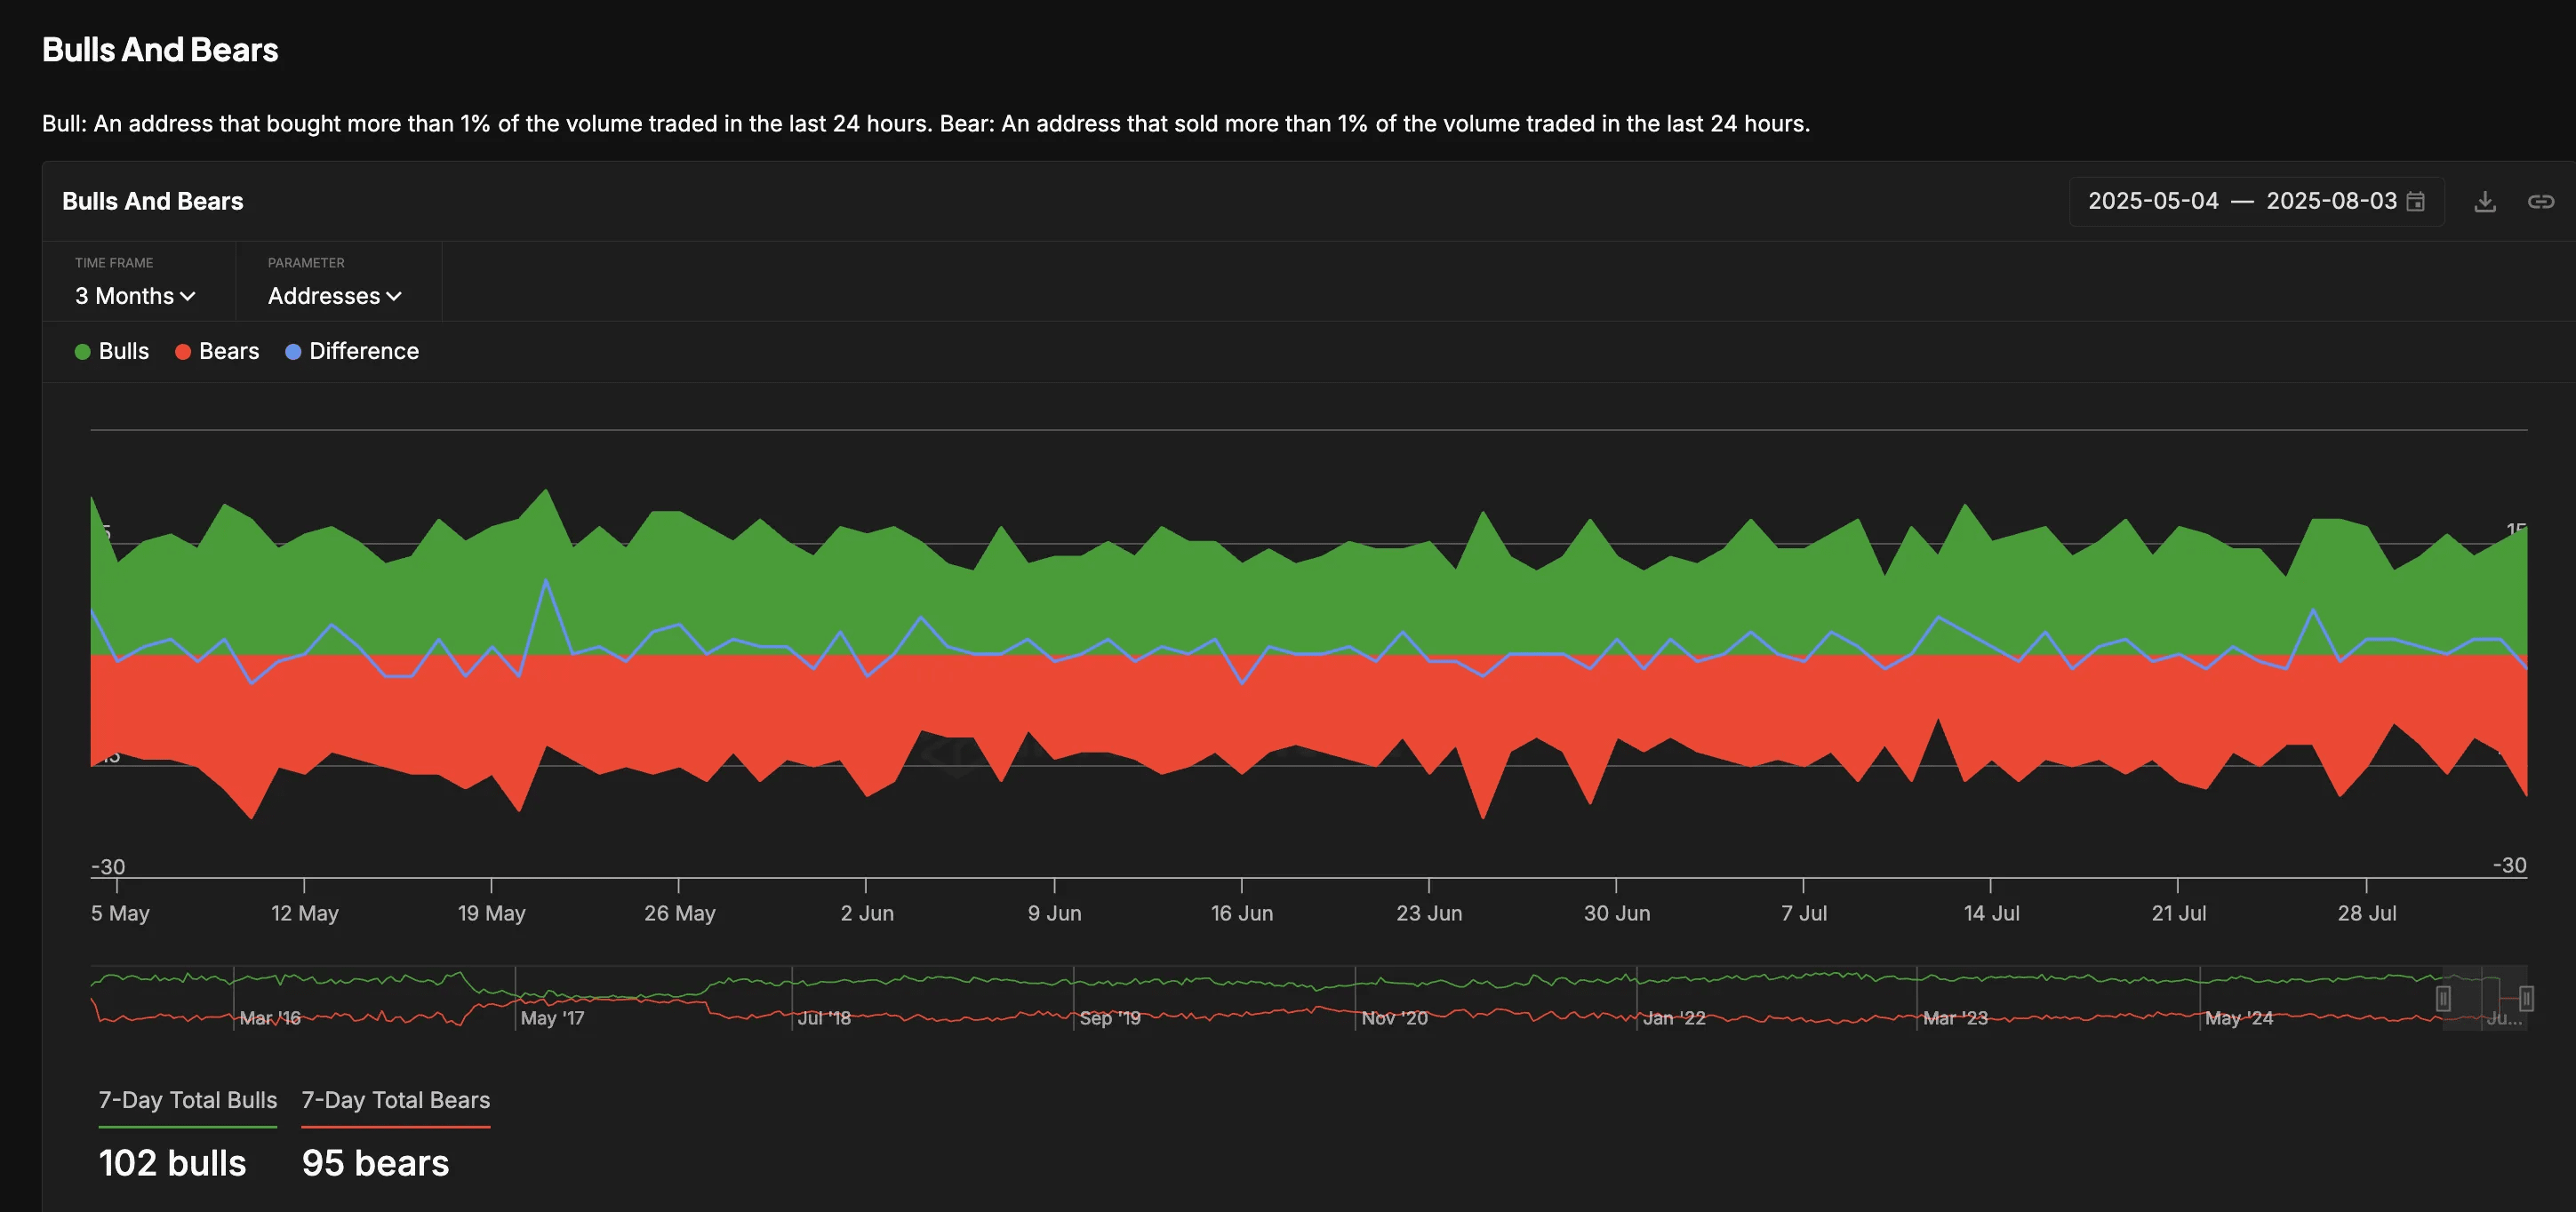
In the past 7 days, the number of bull addresses has surpassed bear addresses at a ratio of 7:1 – a fragile advantage, but enough to show that market confidence is leaning towards accumulation rather than distribution.
The Long/Short Account Ratio Indicates Traders Still Lean Towards Bulls
Despite the sideways trend and continuous declines, traders have not shifted to a pessimistic sentiment. According to the Long/Short account ratio on Binance, this index for Ethereum is currently at 1.91, meaning the number of Long orders is nearly double that of Short.
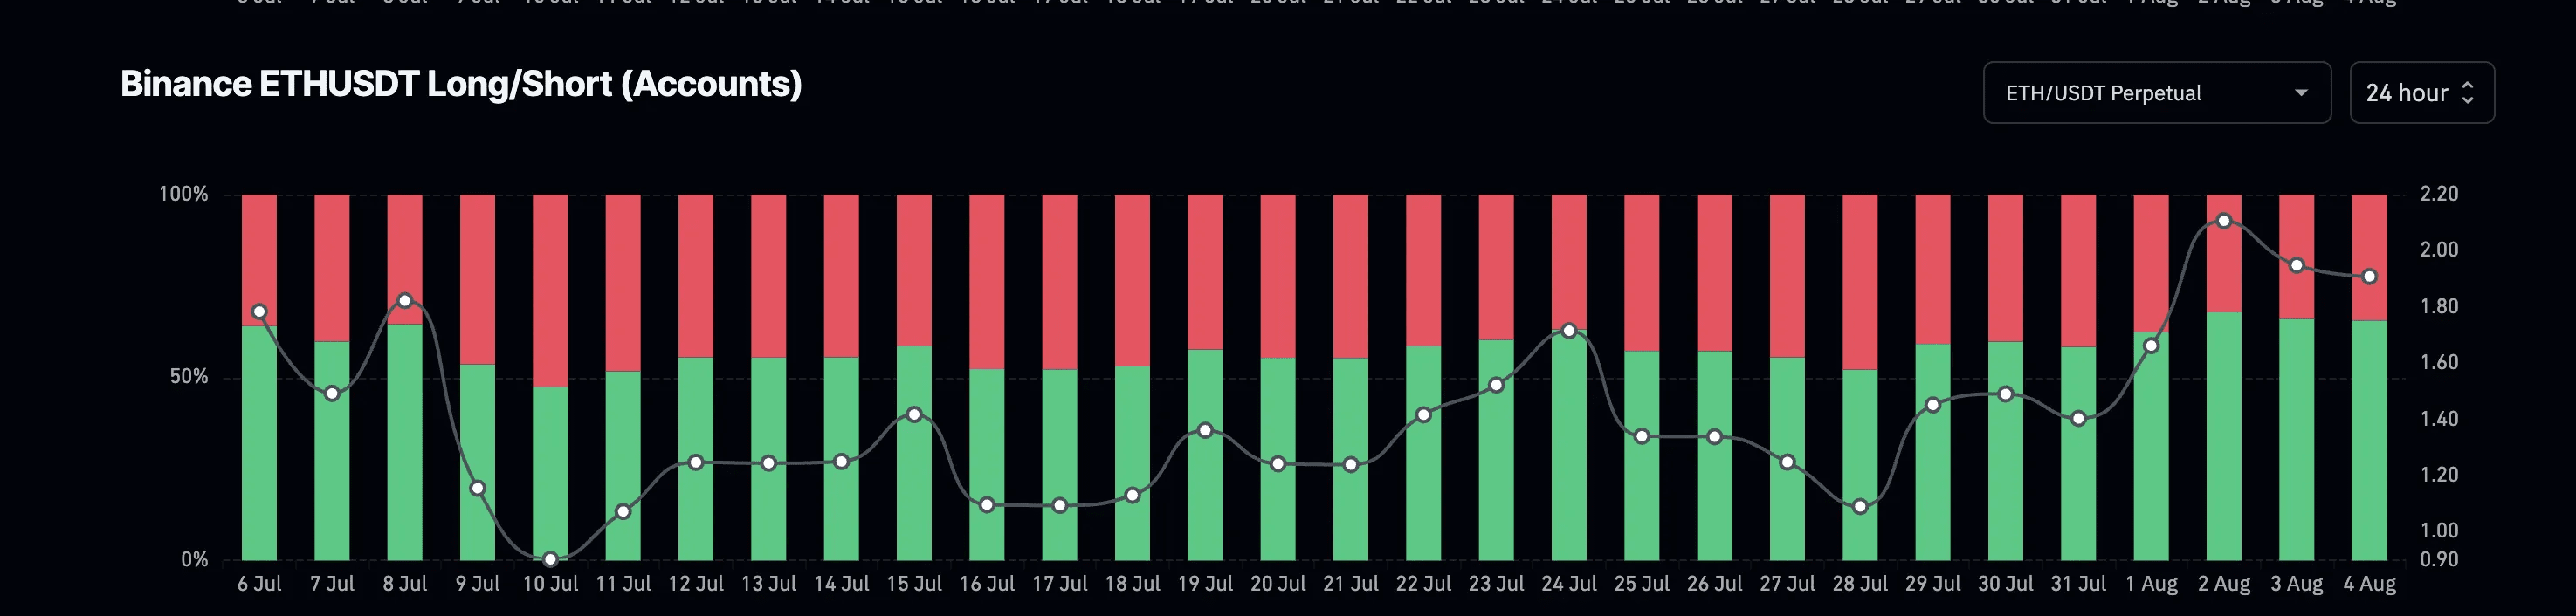
It should be noted that this is not the Long/Short position volume ratio. The account ratio measures the number of user accounts holding Long or Short positions, not just the transaction size.
Data collected in the past 24 hours shows that most traders expect prices to continue rising, even as ETH fluctuates around a key resistance area. Historically, similar ratios often appear just before the market experiences a strong movement in one clear direction.
The Ascending Triangle Pattern Is Still Being Maintained After ETH Tests A Key Support Level
The most noticeable part of the current Ethereum price structure is the ascending triangle pattern on the daily chart. After a strong breakout from the low of $2,120 to $3,939, ETH entered a narrow consolidation phase.
The price level of $3,785 – corresponding to the 0.236 Fibonacci extension level – attempted to serve as a support area but was quickly breached.
Immediately after that, a long red candle appeared, coinciding with the time Short positions in ETH began to dominate. Selling activity continued to increase after this drop, as many traders believed the support level of $3,356 would also be broken.
As predicted, this support line was tested briefly.
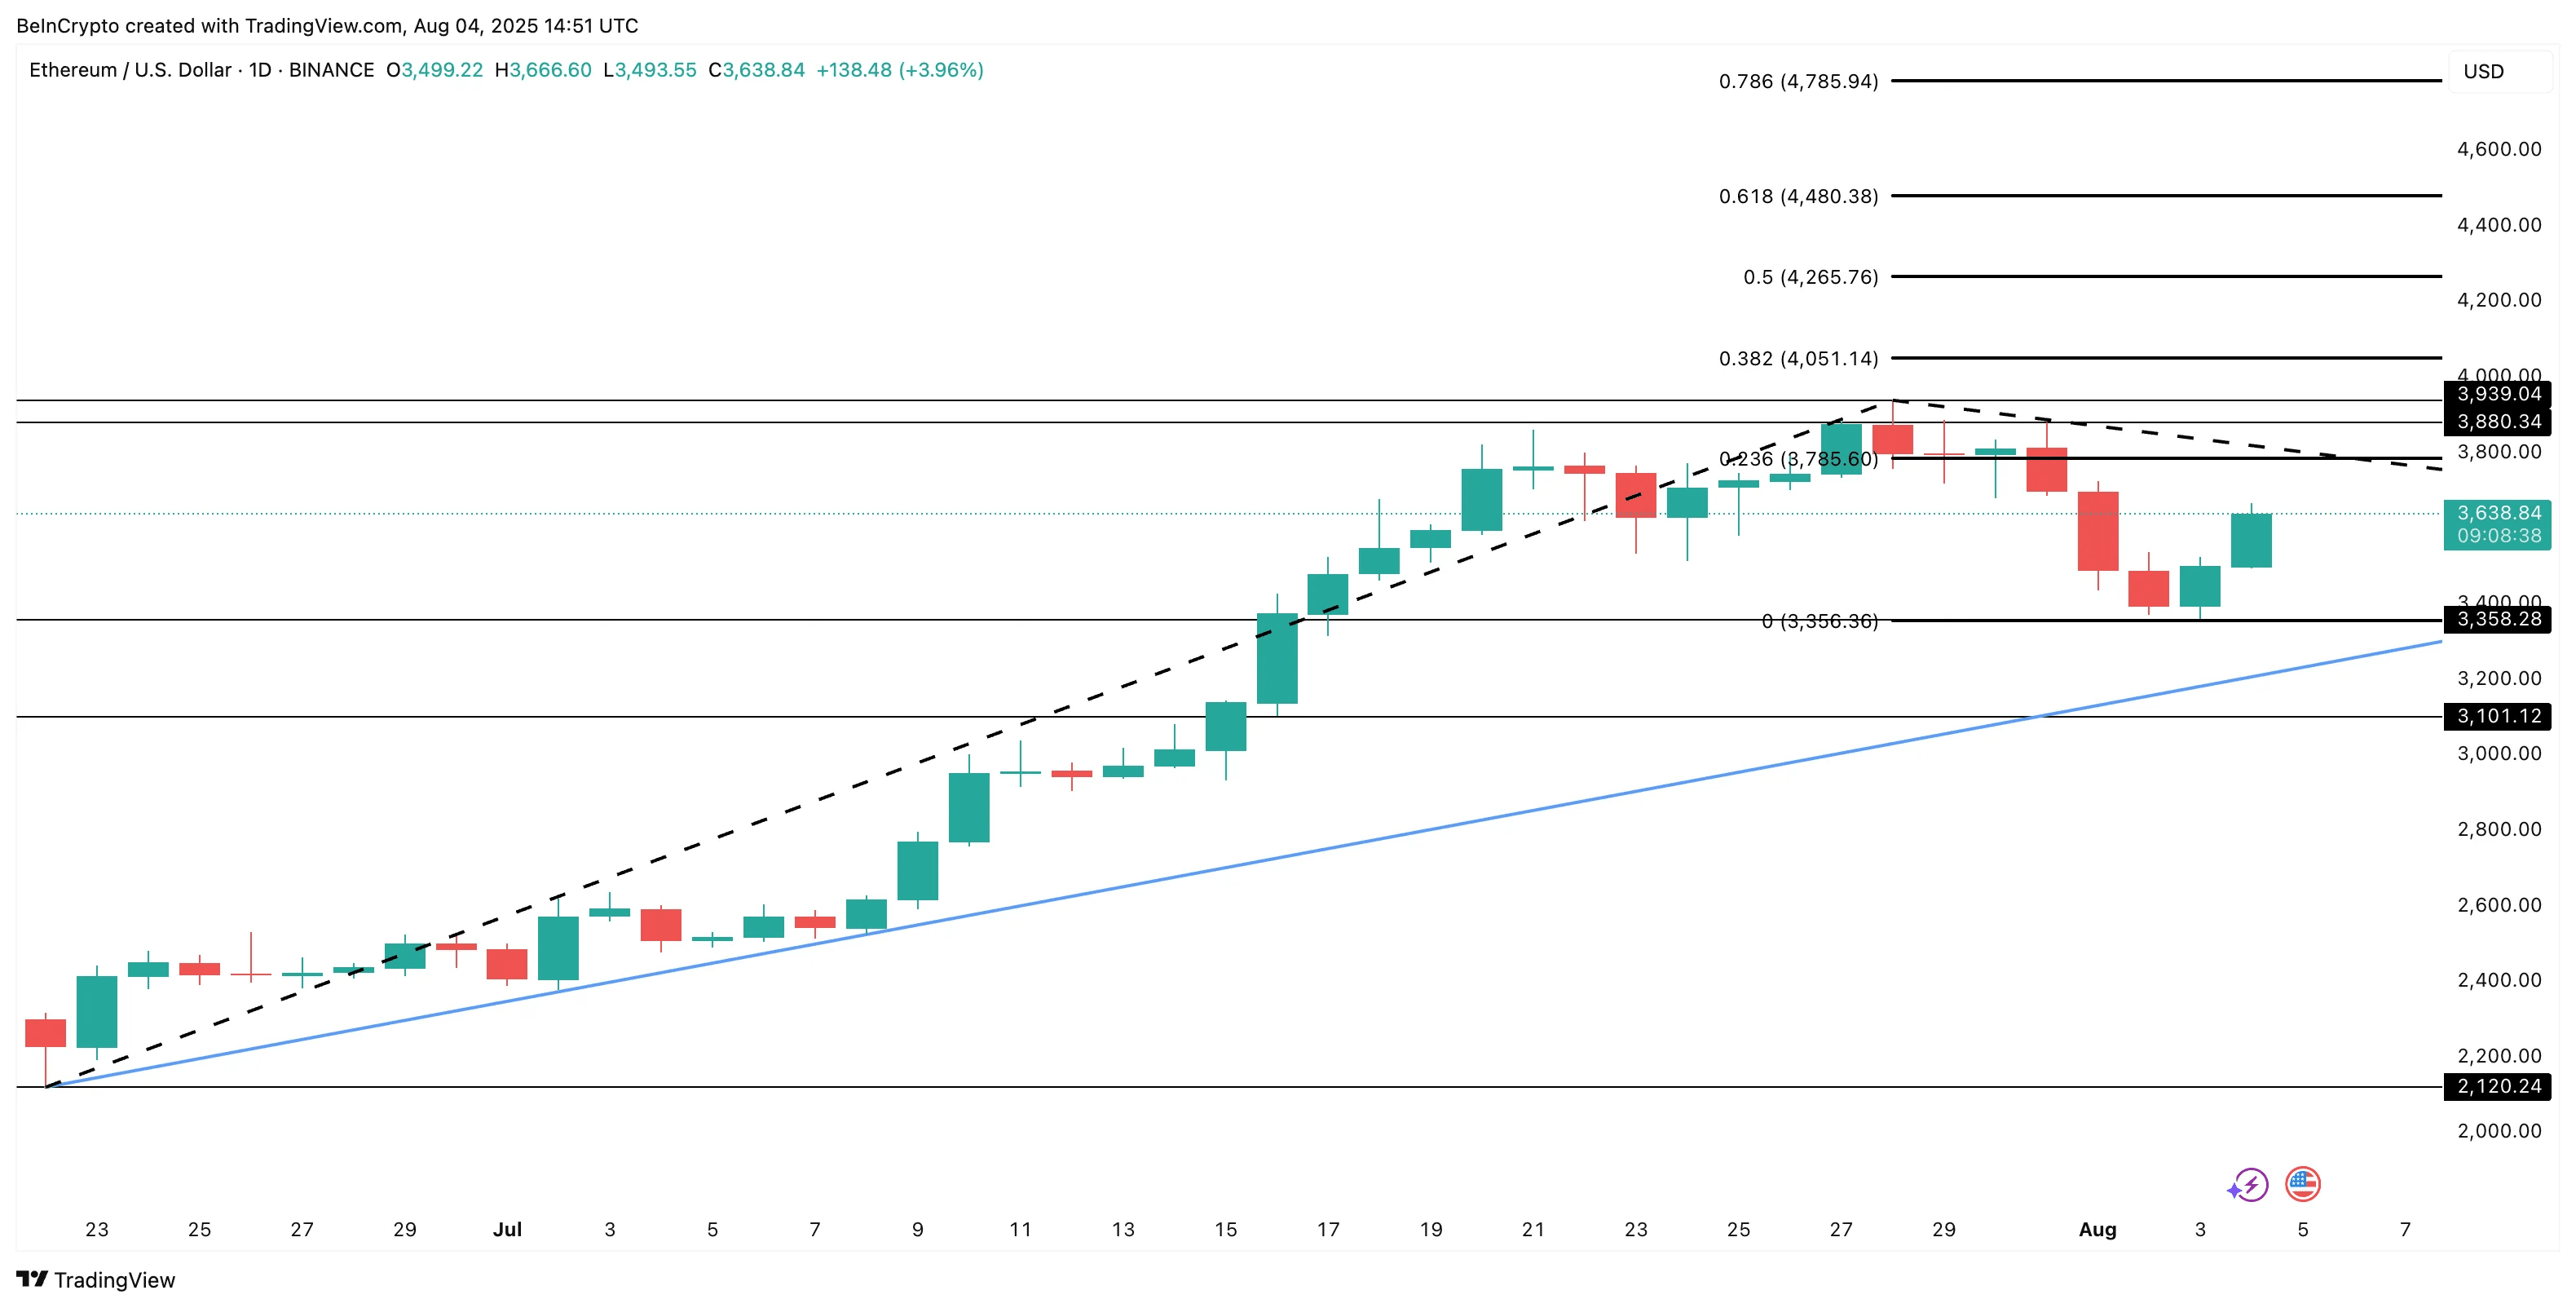
This support line was tested yesterday, coinciding with the time Smart Trader opened a Short position. But shortly after, the price bounced back and triggered the liquidation of that Short position. Thus, a bear has been trapped!
It is not surprising to assume that many similar Short positions have also been opened during that same period, according to data from Lookonchain.
However, if the daily candle closes above $3,785, ETH will have enough strength to test the $3,939 level and then $4,051 — where a rise to $4,051 would be considered a clear breakout. Conversely, if the key support area at $3,356 is completely broken, the bullish scenario will be invalidated.