
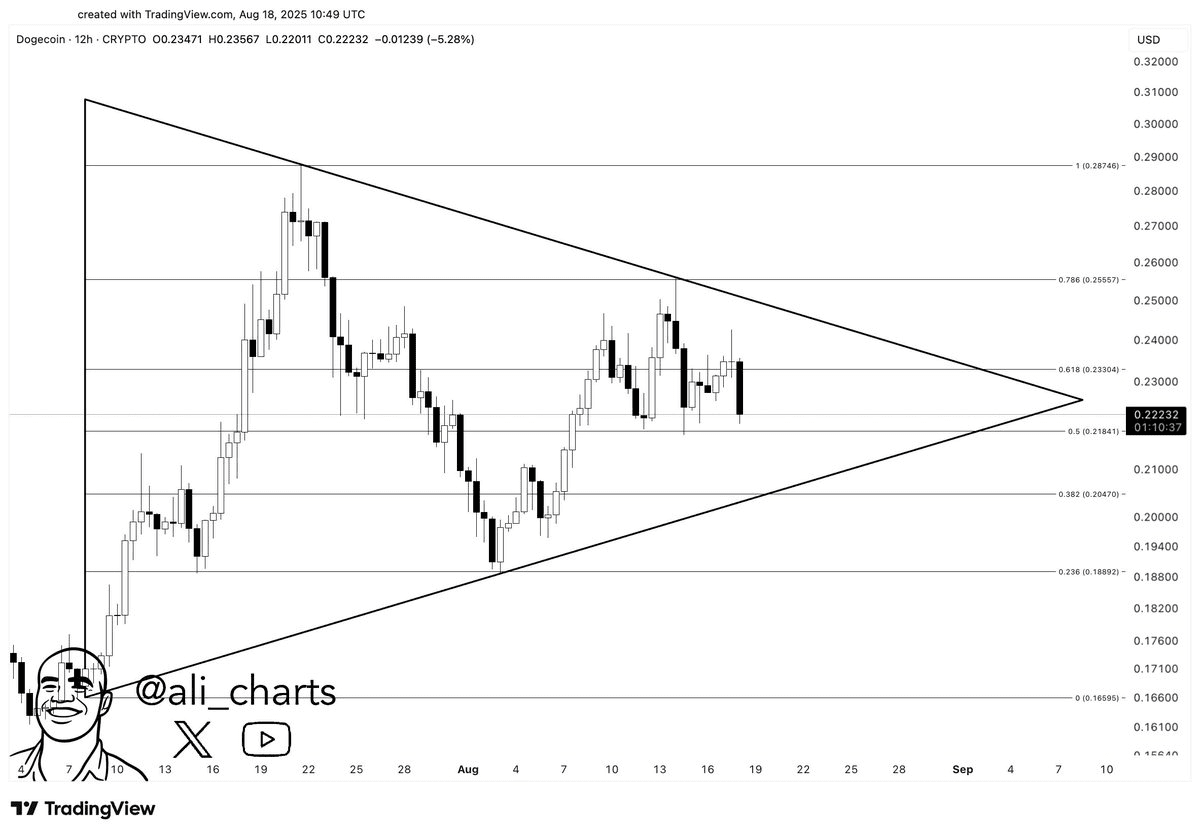
Dogecoin is currently trading within a symmetrical triangle pattern on the 12-hour chart. This pattern consists of lower highs and higher lows, creating a narrow price range. This pattern often appears before significant price volatility in either direction.
At the time of writing, DOGE is trading around $0.22, near the midpoint of the triangle. According to the chart shared by analyst Ali Martinez, the peak of this pattern is expected to form by the end of August. Traders are closely monitoring any breakouts above or below the range of the triangle, which could indicate volatility levels of up to 40% from the breakout point.
Support and Resistance Levels to Watch
The boundaries of the triangle are defined by key Fibonacci retracement levels. The 0.618 level is at $0.233 and is currently acting as a resistance level. On the other hand, the 0.5 retracement level at $0.218 serves as a short-term support level.
If the price exceeds the threshold of $0.233, it could trigger a bullish rally towards the $0.255–$0.287 range. However, if the price drops below $0.218, it could decline to $0.204 or even lower. These thresholds are considered short-term indicators for market trends.
Monthly Chart Shows Repeating Price Structure
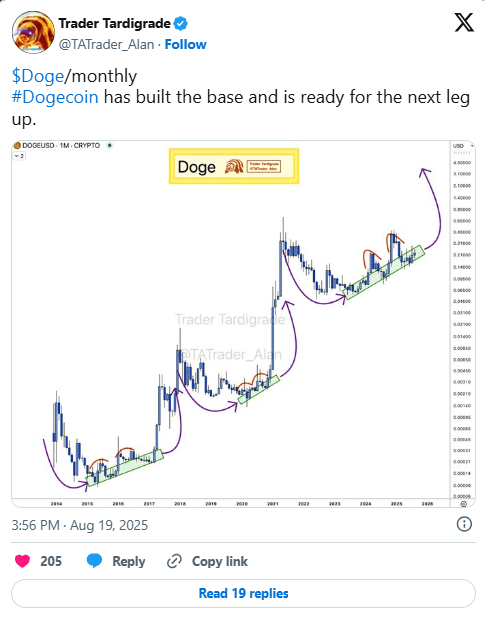
A separate analysis from Trader Tardigrade shows a long-term pattern on the monthly chart of DOGE/USD. The chart displays a rounded bottom followed by a stable ascending channel, similar to previous cycles. Dogecoin has followed this structure in the past before a strong upward move.
According to the chart, DOGE is currently at the end of an ascending channel. This pattern is similar to those seen before previous bullish rallies.
"The chart shows that a base has been formed and DOGE may be preparing for the next bullish rally," the analyst noted.
Market Sentiment and Trading Activity
The 24-hour trading volume of Dogecoin is currently around $2.79 billion, reflecting positive interest from the market. The price has decreased by 1% over the past 24 hours and 2% over the past seven days. However, traders remain focused on the narrowing triangle pattern and the potential for a breakout.
Analysts are anticipating a surge in trading volume as a confirmation for the next move. A clear breakout beyond the current range, supported by strong buying or selling pressure, could support the proposed 40% price volatility in technical forecasts.
Although previous cycles have followed a similar direction, some traders remain cautious. "There is no guarantee that this pattern will repeat," one user noted, reflecting a cautious outlook as the market waits for a clear signal.
