There are two forces in the market competing: bulls and bears.
When both sides are in a state of balance, the price trend is in a range oscillation; when there is a divergence and supply-demand imbalance, the price trend is in a unidirectional trend market.
In the world, unity leads to division, and division leads to unity. We view range oscillation as a price trend of volume accumulation and a unidirectional trend as a price trend of capacity release. The two can transform into each other and cycle back and forth, meaning that after oscillation accumulation comes trend release, and after trend release comes oscillation accumulation, thus creating an infinite cycle.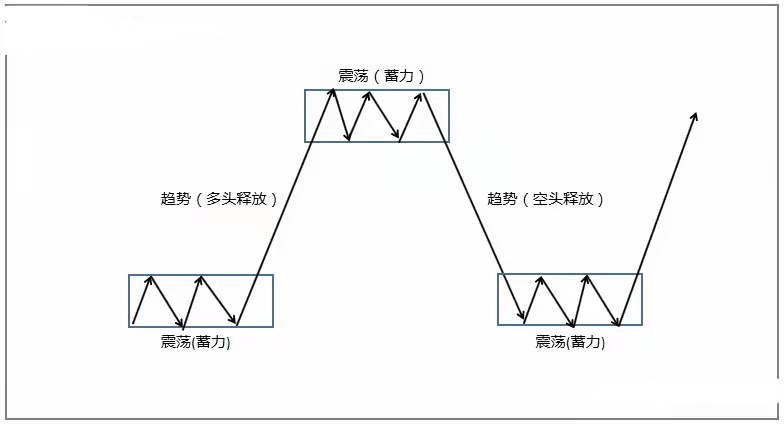
It is said that the length of the horizontal movement determines the height of the vertical movement, indicating that the size of the oscillation accumulation determines the length of the trend market. Therefore, to capture trend markets, we should first pay attention to the accumulation situation of the oscillation.
So what are the forms of oscillation accumulation?
First, we define the oscillation accumulation trend. Theoretically, trends located between previous highs and lows can be regarded as a type of oscillation accumulation trend, such as: the engulfing pattern is the most typical oscillation accumulation candlestick combination, pullbacks in uptrends, rebounds in downtrends, rectangles, converging triangles, etc.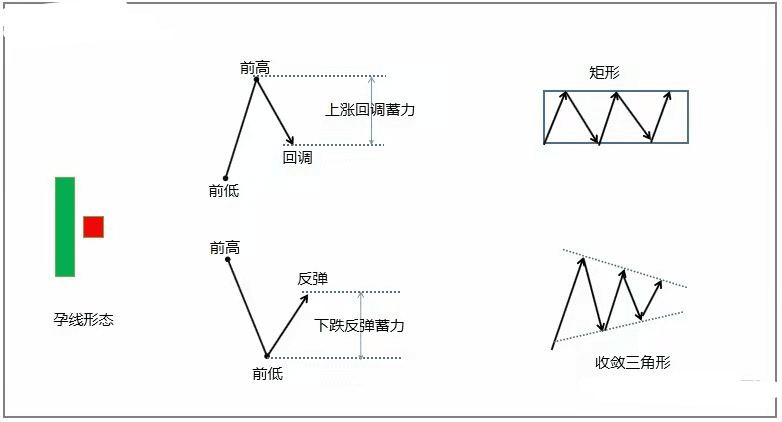
Accumulation is not just a sideways oscillation; pullbacks in uptrends and rebounds in downtrends are also forms of accumulation. Ascending wedges and descending wedges also represent accumulation, and chaotic range oscillations are also a form of accumulation. However, we should focus on those accumulation patterns with clear, orderly, and regular boundaries, such as engulfing patterns, rectangles, converging triangles, etc.
The volume accumulation in oscillation accumulation patterns varies in size. We primarily evaluate its strength from two dimensions:
1. Time span
2. Pullback strength
The time span refers to the duration of the price movement. For example, within the same time period, 10 candlesticks will definitely take longer to run than 5 candlesticks. Theoretically, the time span of 10 candlesticks is stronger than that of 5 candlesticks in terms of accumulation.
Pullback strength refers to the magnitude of the pullback in the trend. For example, a pullback of 50% in an uptrend is certainly larger than a pullback of 20%. Theoretically, a larger pullback amplitude indicates stronger accumulation than a smaller pullback amplitude. However, extremes can lead to reversals; if the pullback exceeds 50%, it may be too large and could lead to a reversal.
Whether in terms of time span or pullback strength, there must be a measure; extremes, whether too large or too small, will affect the quality of accumulation. In practical analysis, the accumulation pattern is comprehensively analyzed based on these two dimensions, where 'sufficient' means whether the adjustment is adequate and whether the risk release is adequate.
Comparison of N-type and rectangles, comparison of simple pullbacks and complex pullbacks, as shown in the figure below: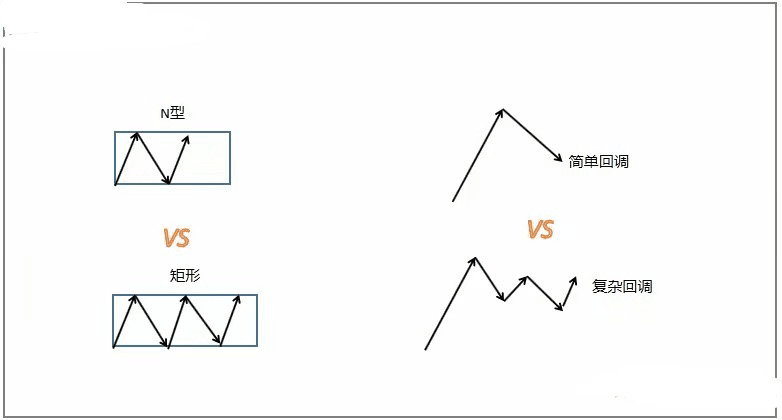
Comparison of N-type and rectangles: with the same amplitude, the time span of a rectangle is longer than that of an N-type, and the trading density of a rectangle is greater, accumulating more volume. Once it breaks through the resistance level, the trend market of the rectangle often has more explosive power than that of the N-type.
Comparison of simple pullbacks and complex pullbacks: with the same amplitude, a simple pullback has a shorter time span while a complex pullback has a longer time span. Therefore, the risk released by a complex pullback is more pronounced than that of a simple pullback. Once the uptrend resumes, theoretically, the trend from a complex pullback will be more sustained.
Next, I will share a simple and practical accumulation pattern in real trading: rectangle.
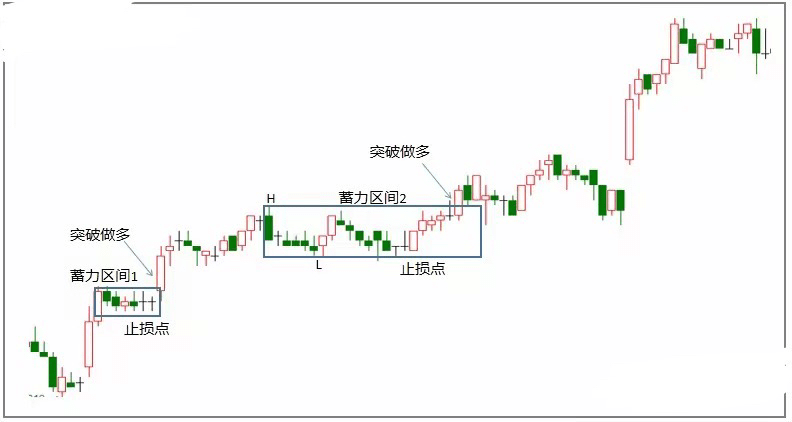
A rectangle is a range oscillation sideways trend and is a relatively common accumulation trend in price movements. The mnemonic for identifying and trading it is: one high one low + breakthrough.
One high refers to the resistance level of the range, one low refers to the support level of the range, and a breakthrough indicates a breakout from the range, which is the entry point.
For example:
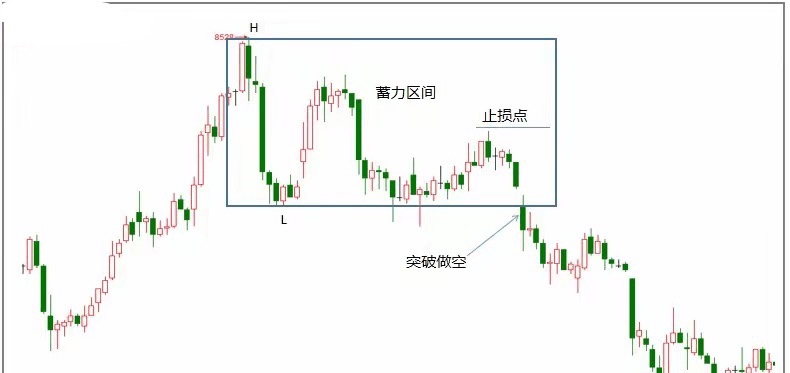
In an uptrend, when the price falls from a high point, it establishes a high point of the range, and the low point of the fall establishes a low point of the range. In the future, breaking through the high point of the range indicates a long position, while breaking down the low point of the range suggests exiting or considering a short position.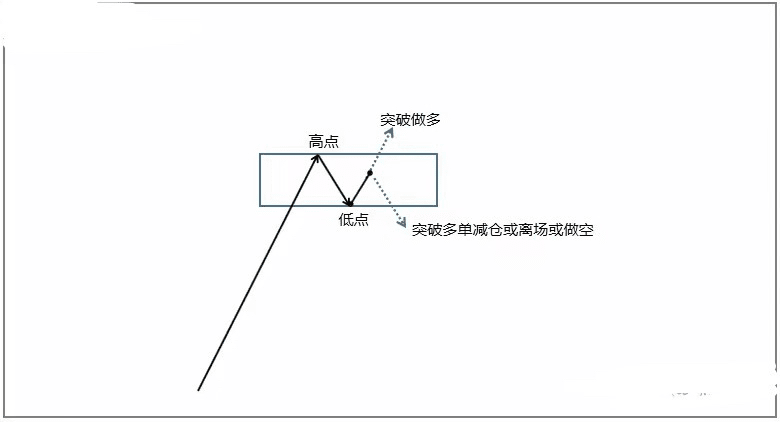
Case appreciation: