
Bitcoin's months-long rally appears to have hit a significant resistance level, with a convergence of bearish signals emerging on both the weekly and daily charts.
Bitcoin: Risk of Deeper Decline
Bitcoin's months-long rally seems to have met a significant barrier, with a convergence of bearish signals appearing on both the weekly and daily charts.
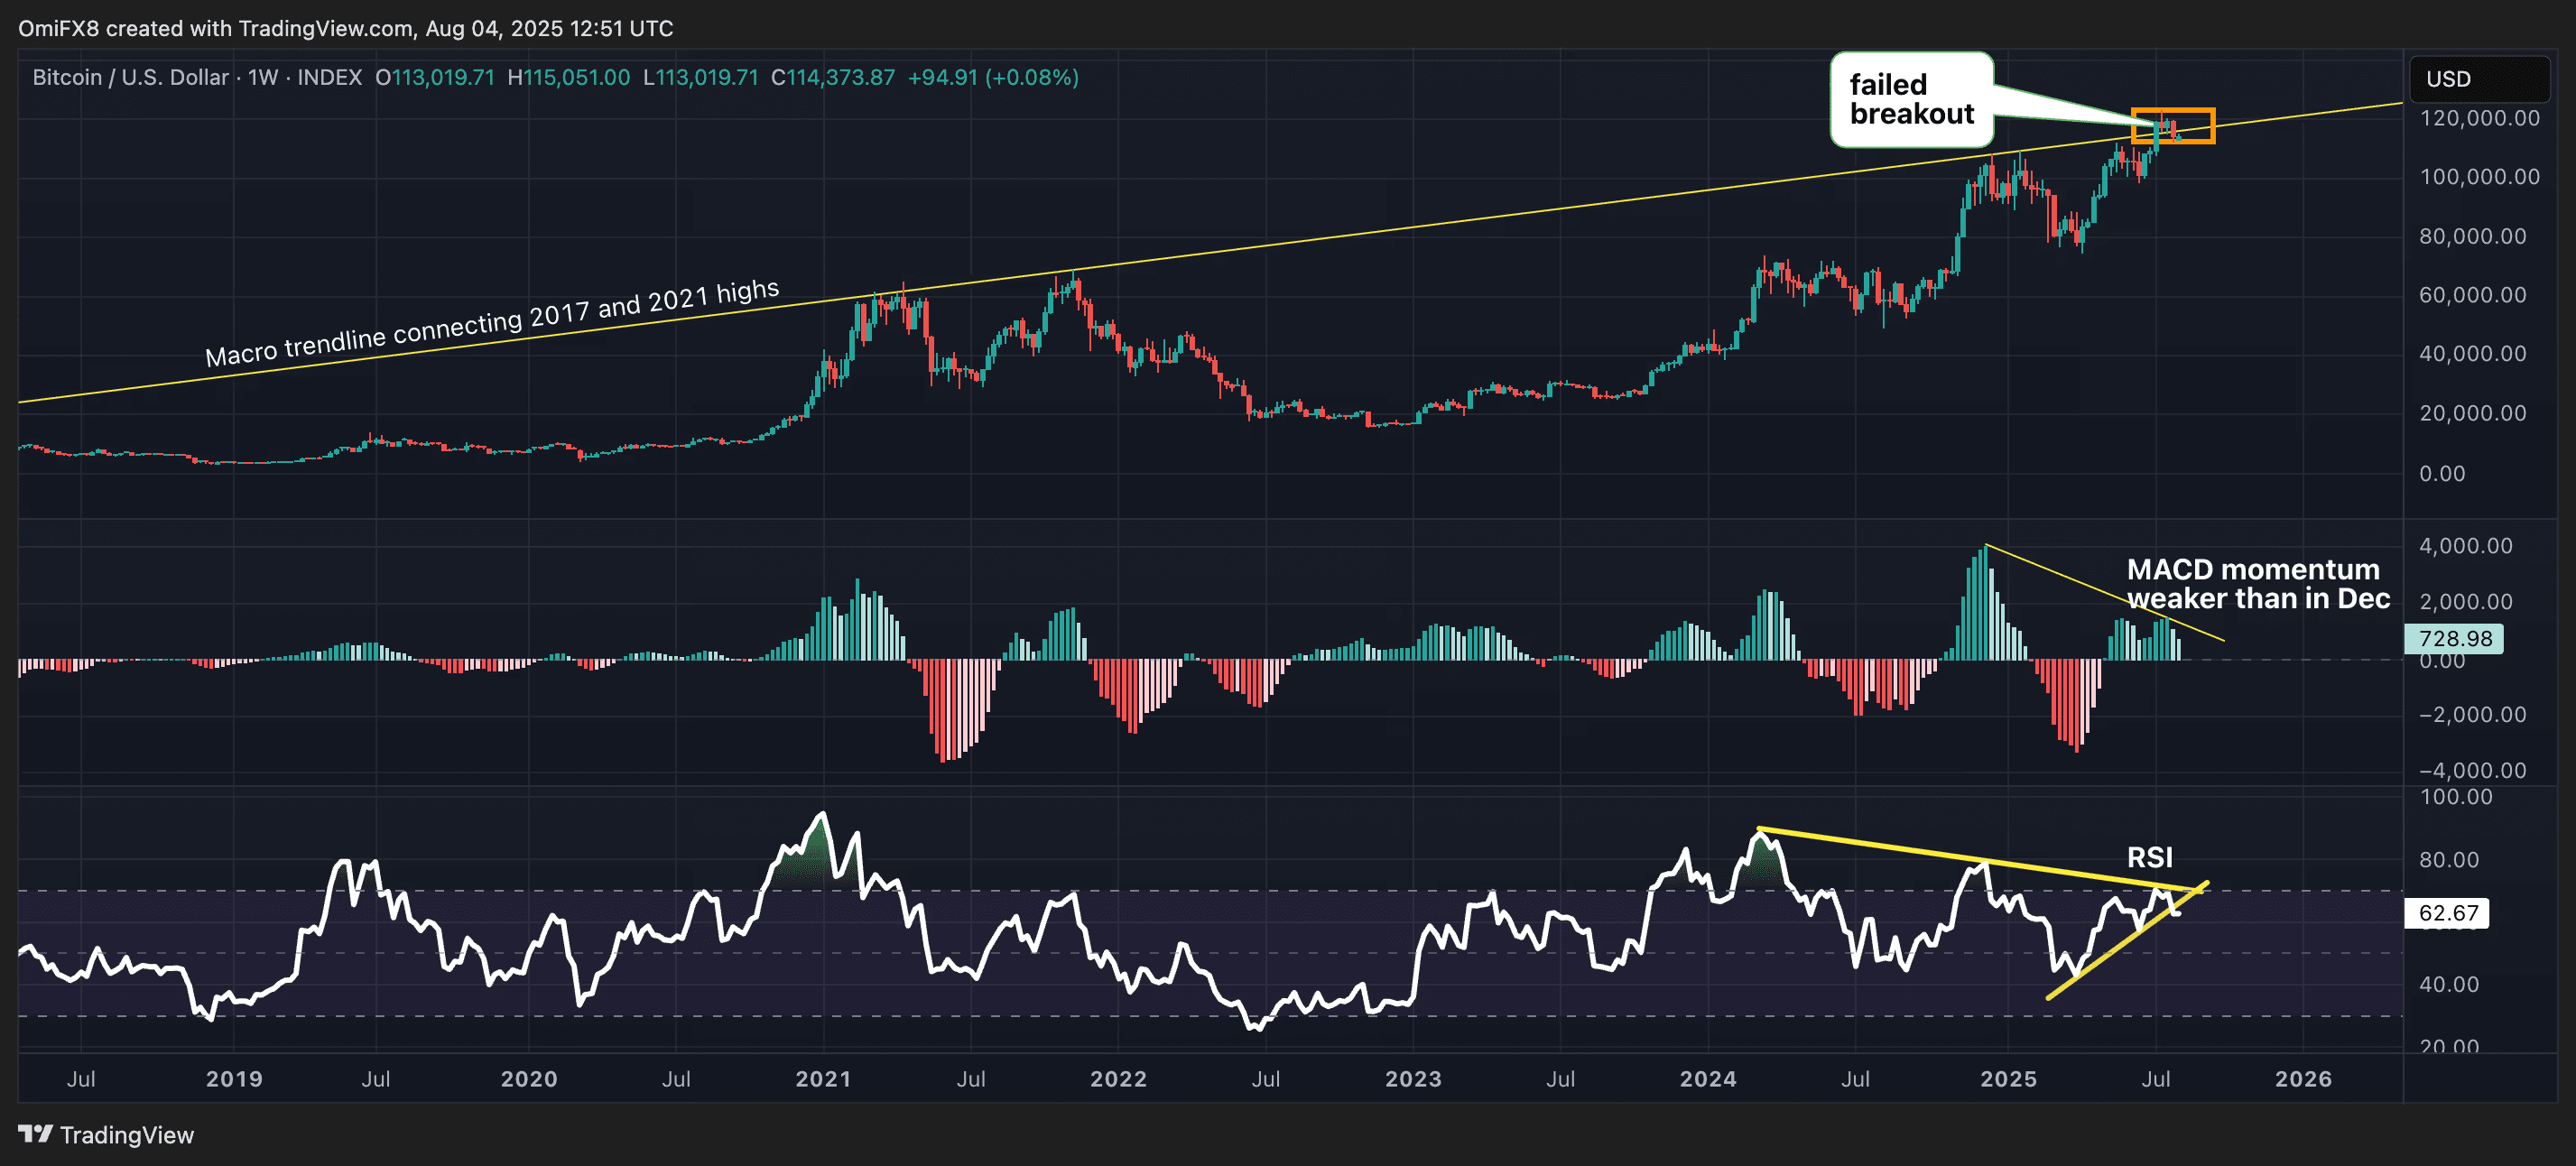
The weekly candlestick chart shows that buyers have been unable to establish a foothold above the macro trend line connecting the peaks of the bull markets in 2017 and 2021. This failed breakout is supported by declining momentum, as the MACD chart, while still positive, is significantly lower than the peak in December 2024 when the macro trend line was tested for the first time.
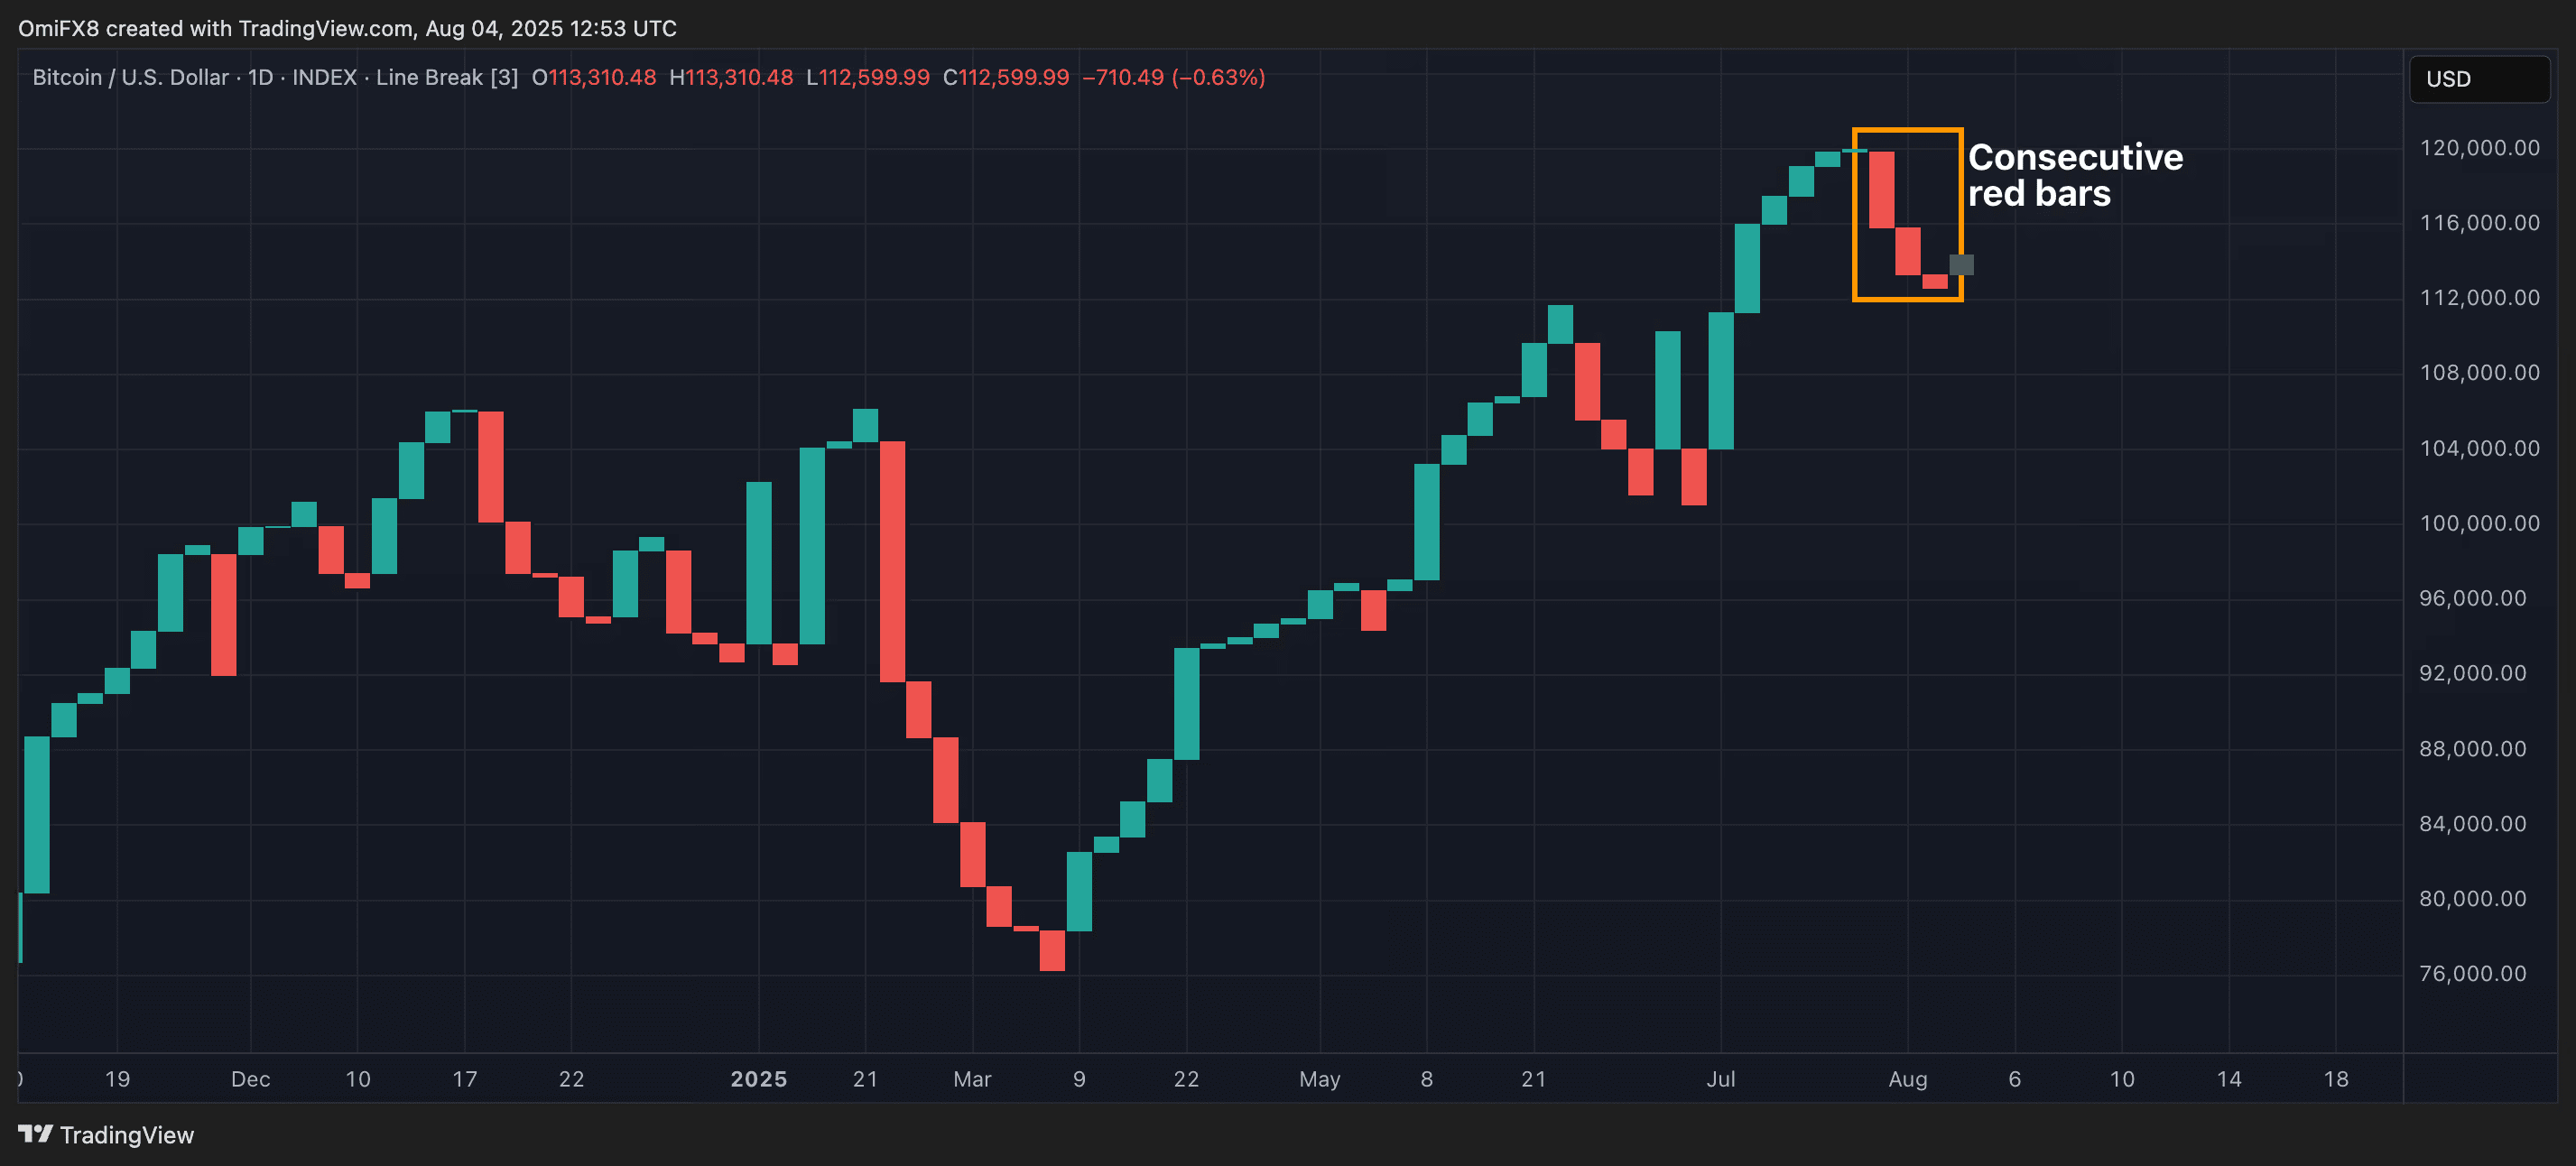
On the shorter daily timeframe, the momentum shift is even more pronounced. The three break line chart, a tool designed to filter out minor noise and confirm trend changes, has generated three aligned red bars, a classic bearish reversal signal, confirming that the sellers have taken control.
The combination of these signals - a failed long-term breakout, weakened momentum, and a confirmed short-term reversal - suggests that a deeper correction is now the path of least resistance, and prices may breach the immediate support level at $11,965, the previous high reached in May, to test bearish demand at $100,000.
The price needs to surpass $122,056 to invalidate the bearish trend.
Resistance levels: $120,000, $122,056, $123,181.
Support levels: $111,965, $112,301 (50-day SMA), $100,000.
XRP: Challenging the Downtrend Line
While XRP is trying to break out of the downtrend line, showing a recent correction, the overwhelming momentum from the moving averages on both the hourly and daily timeframes suggests that a sustainable breakout may not happen immediately.
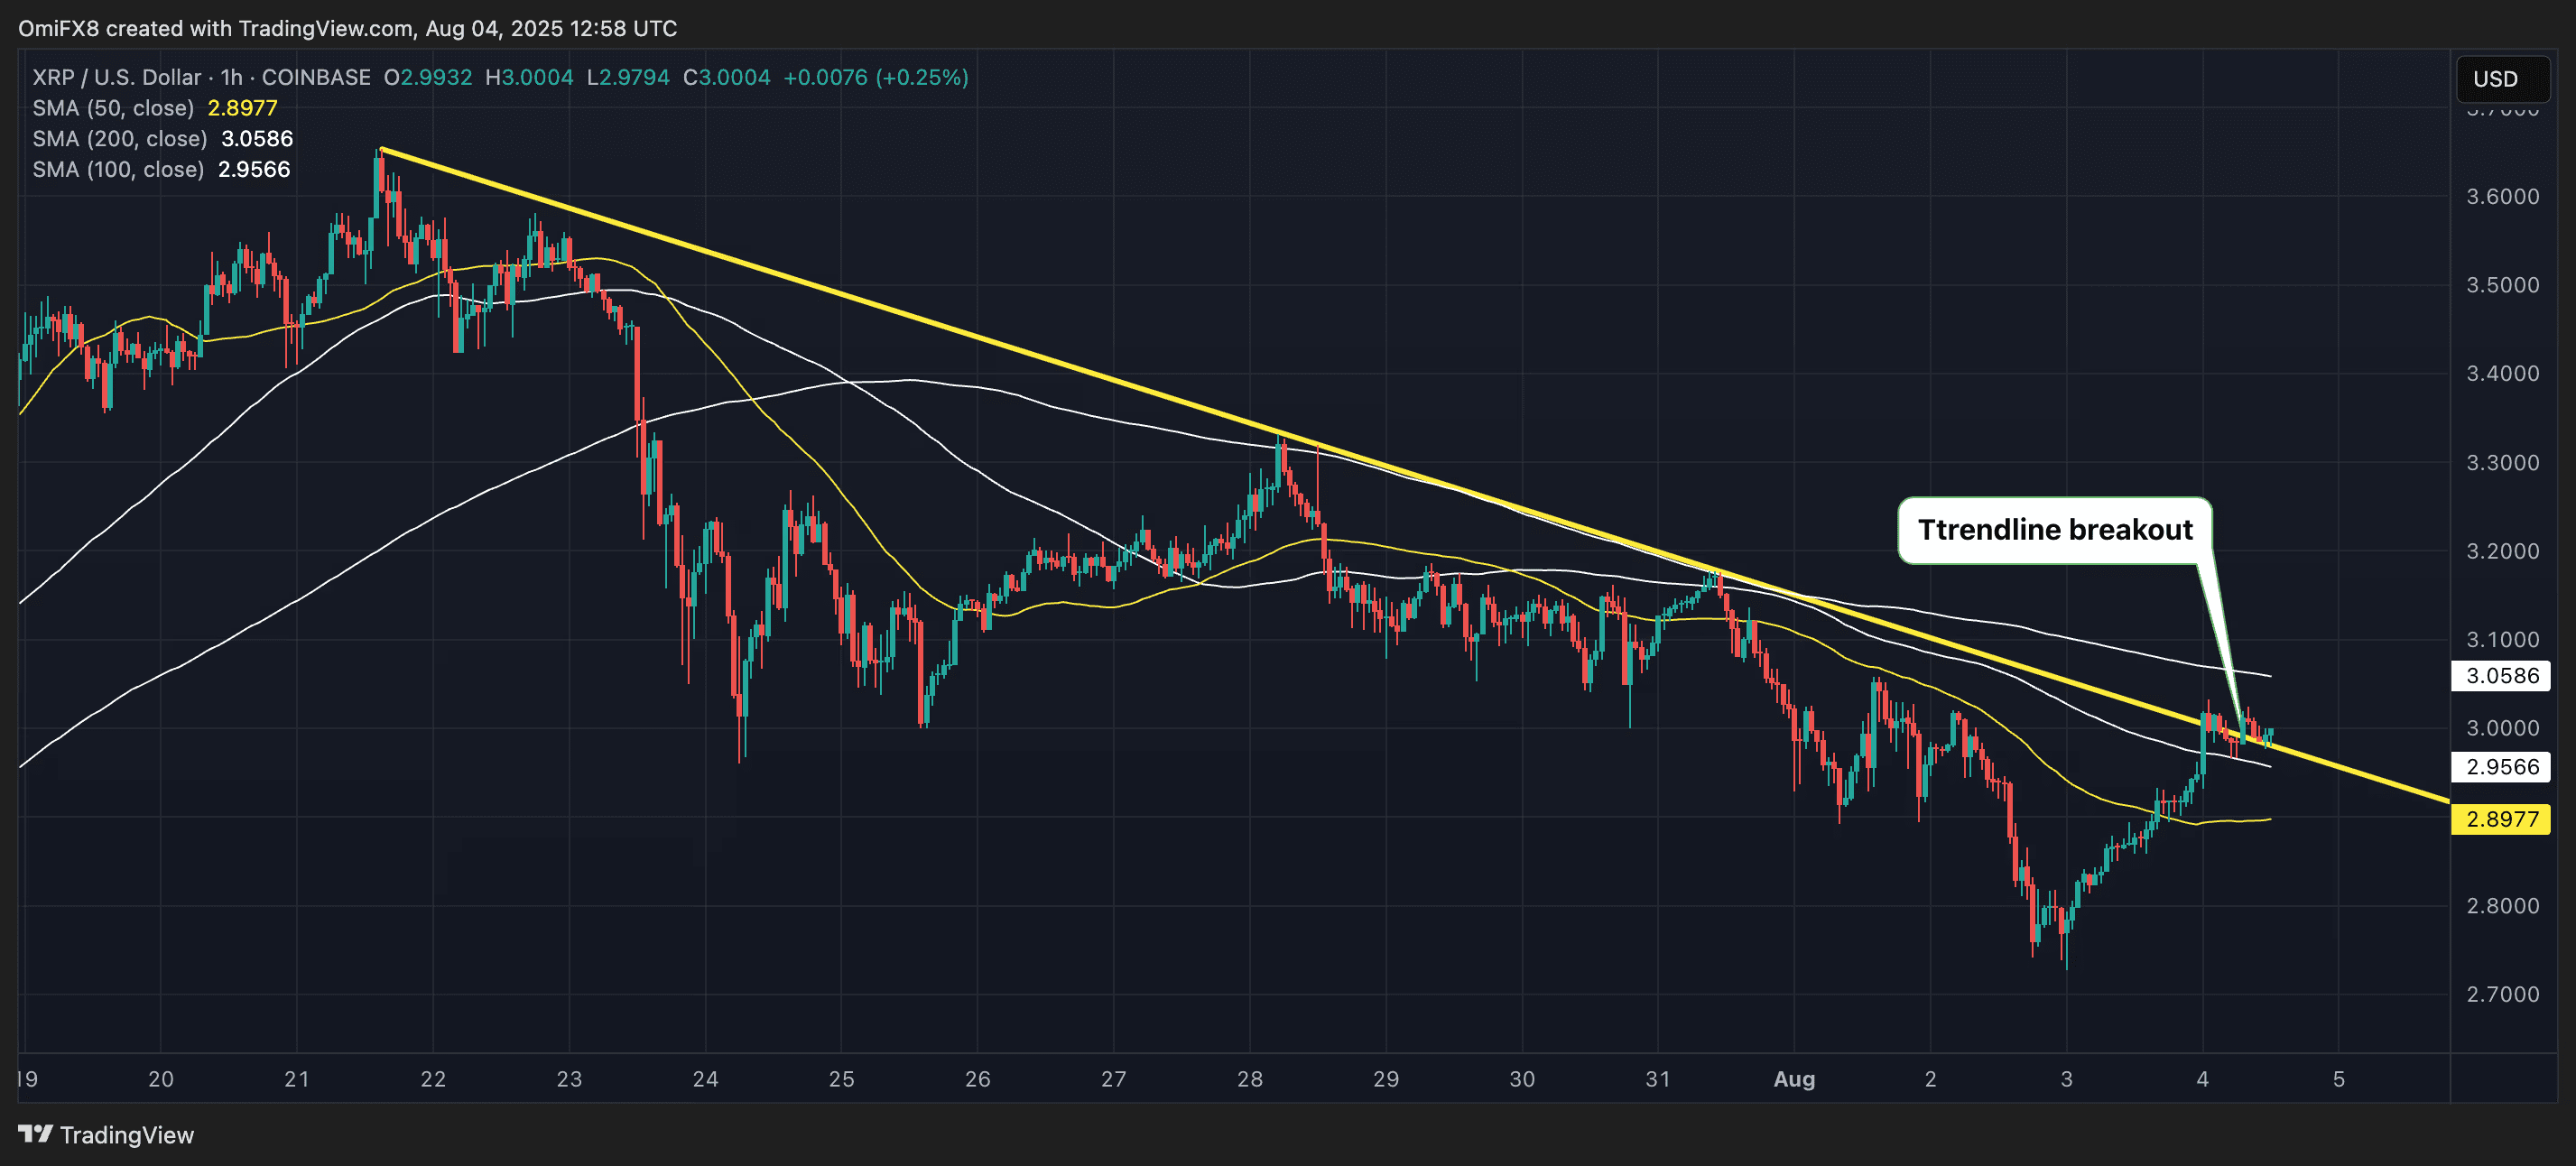
On the daily timeframe, prices have seen a slight recovery, but this upward momentum is being halted by the 38.2% Fibonacci retracement level, which is acting as an important resistance. This corrective move occurs in a bearish context, with both the 5-day and 10-day simple moving averages (SMA) continuing to decline, confirming the downtrend. Furthermore, the 50, 100, and 200-hour SMA lines are stacked in a bearish configuration, all trending downward, a typical technical signal of a strong downtrend.
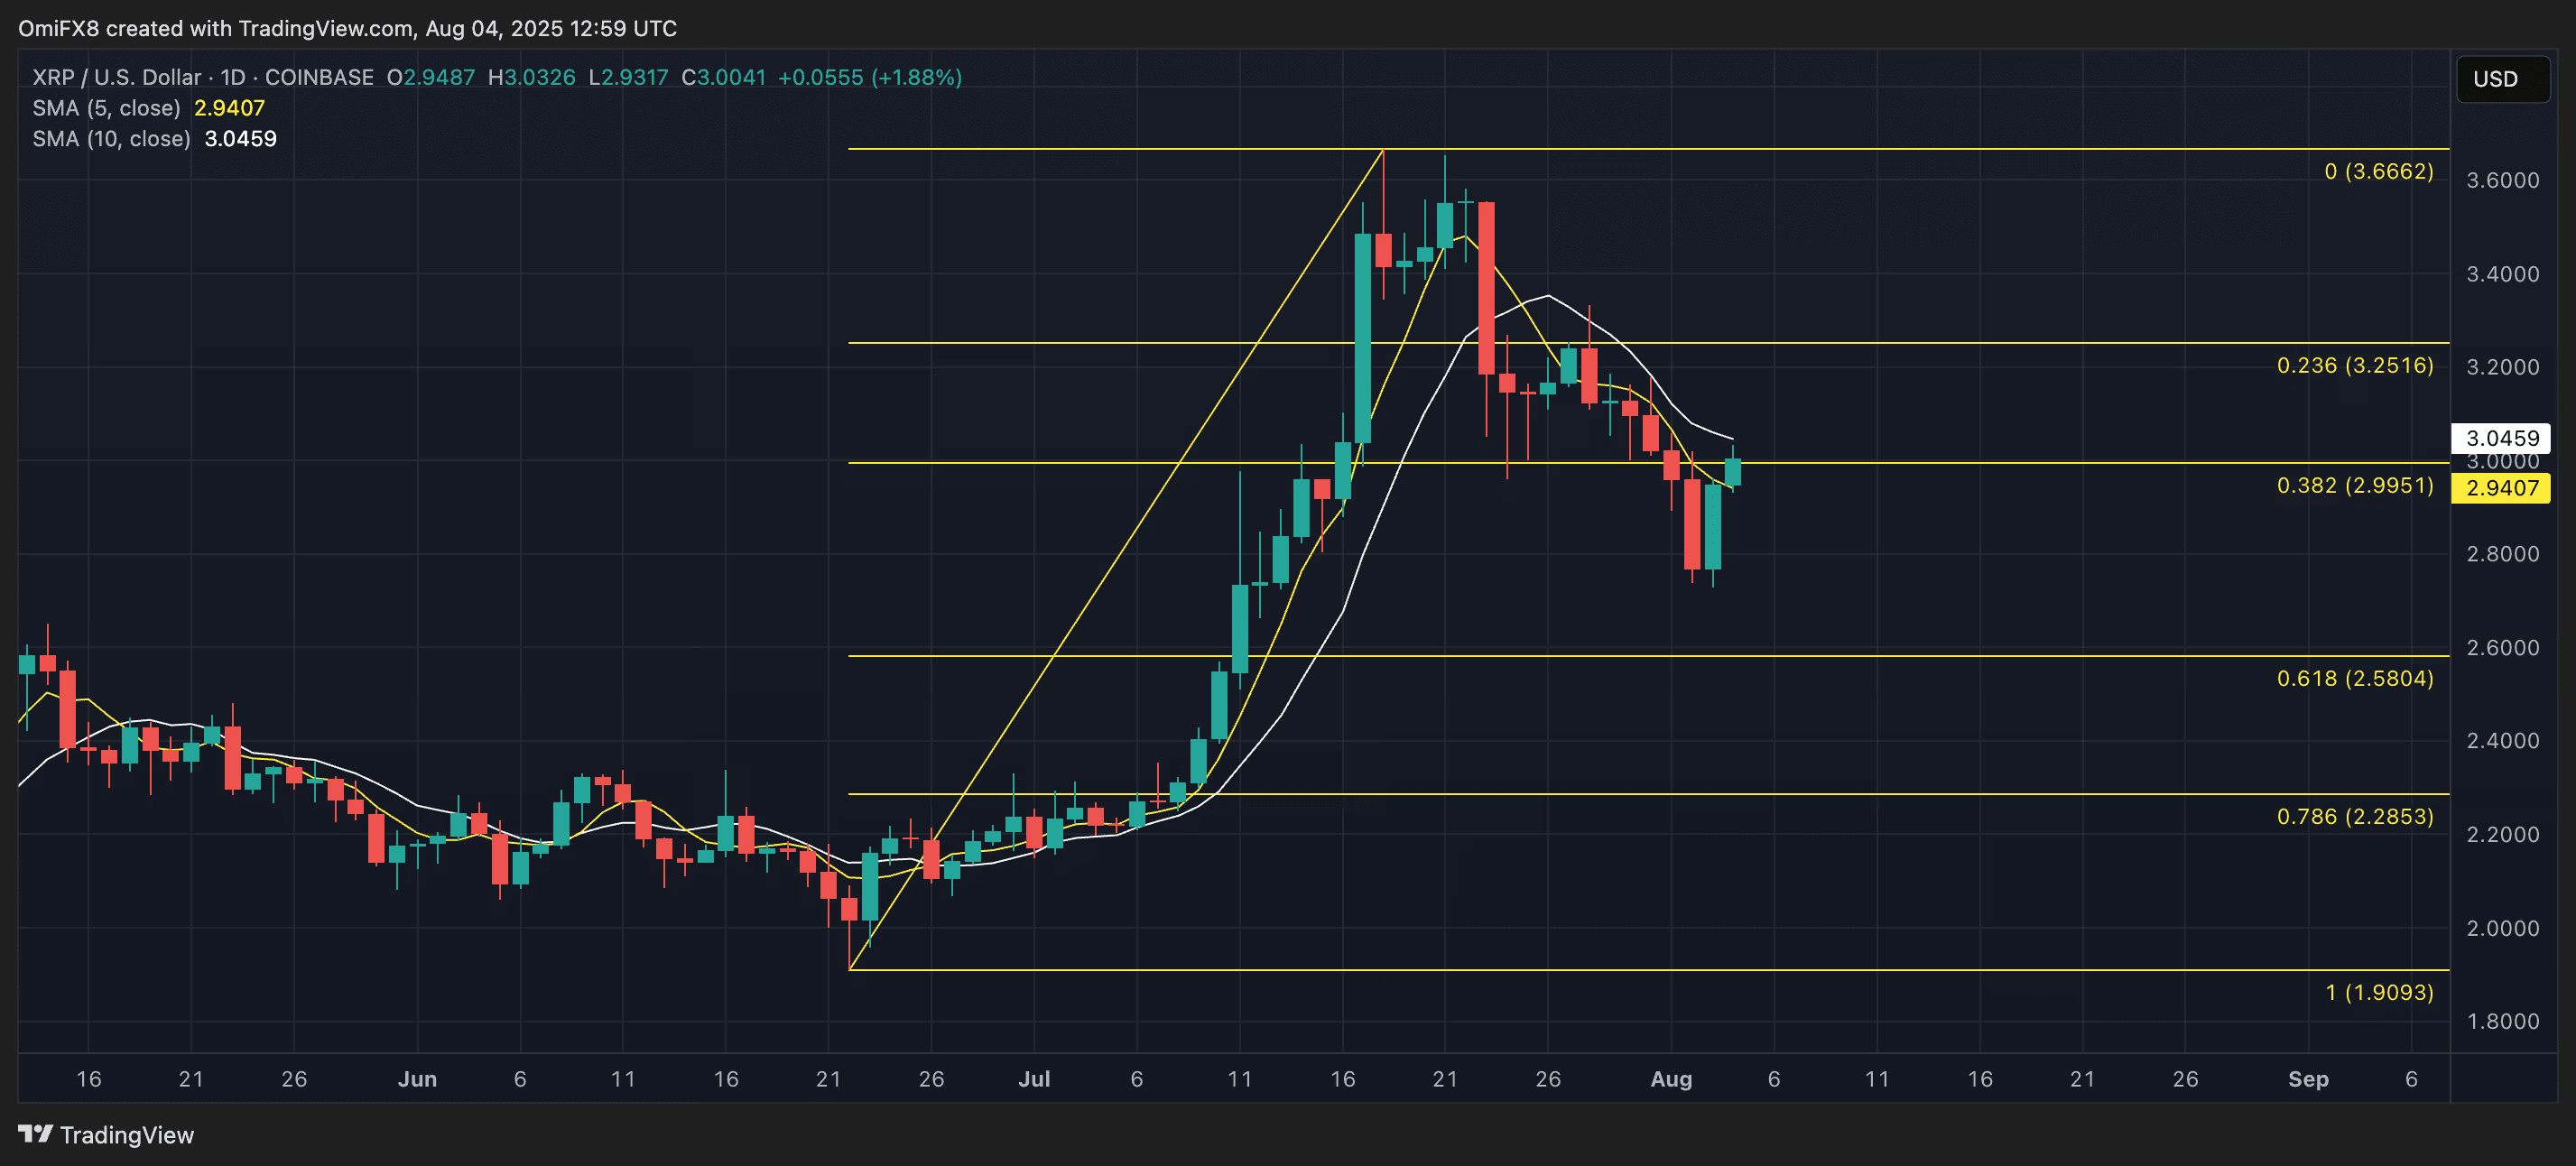
If the price closes above $3.00, focus will shift to the lower high of $3.33 recorded on July 28.
Resistance levels: $3.33, $3.65, $4.00.
Support levels: $2.72, $2.65, $2.58.
Ether: Bearish Outside Week
Ether dropped nearly 10% last week, forming a large bearish outside week candle, a significant bearish pattern, indicating that sellers are looking to regain control.
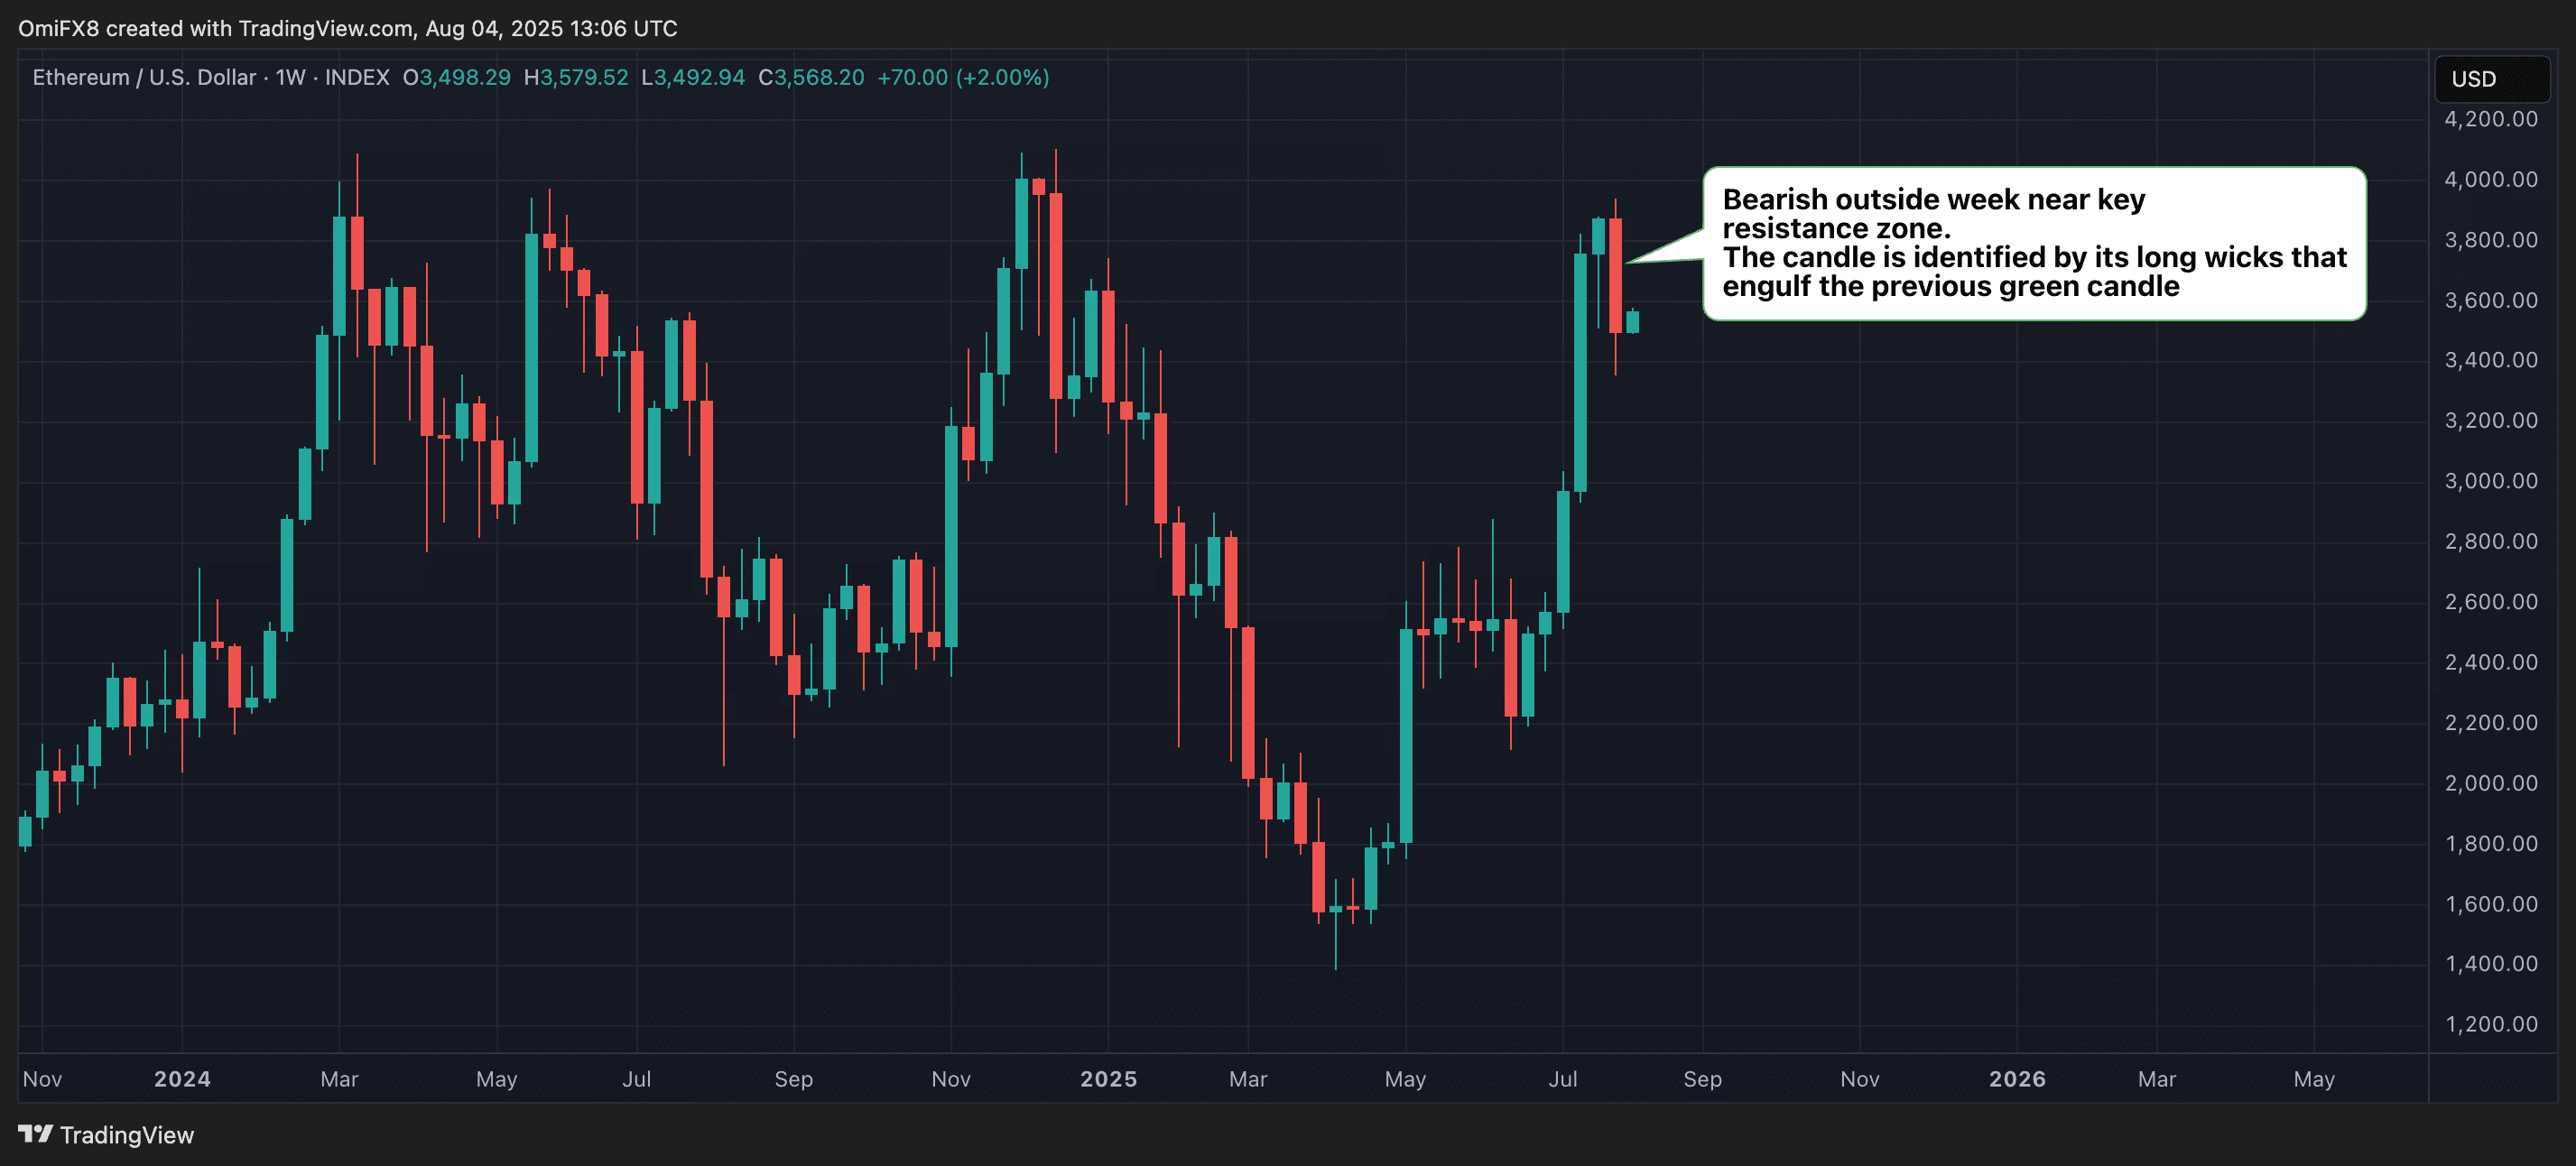
This sentiment is reinforced on the daily timeframe. The daily candlestick chart shows that the 5-day and 10-day SMA have formed a bearish crossover, confirming the breakdown of the short-term uptrend.
Thus, while the price has seen a slight recovery since Sunday, its strength remains in question. This is further supported by the daily three break line chart, with two consecutive red bricks - a clear bearish signal, confirming that the trend has reversed to bearish.
The combination of these long-term and short-term charts indicates that the path of least resistance is currently lower.
Resistance levels: $3,941, $4,000, $4,100.
Support levels: $3,355, $3,000, $2,879.
Solana: Golden Cross
Solana's recent pullback seems to be facing an important test, as buyers have successfully defended the important support level in the past 24 hours. The price has bounced back from the 61.8% Fibonacci retracement of the recent rally, a level often seen by traders as a strong potential bottom in an uptrend.
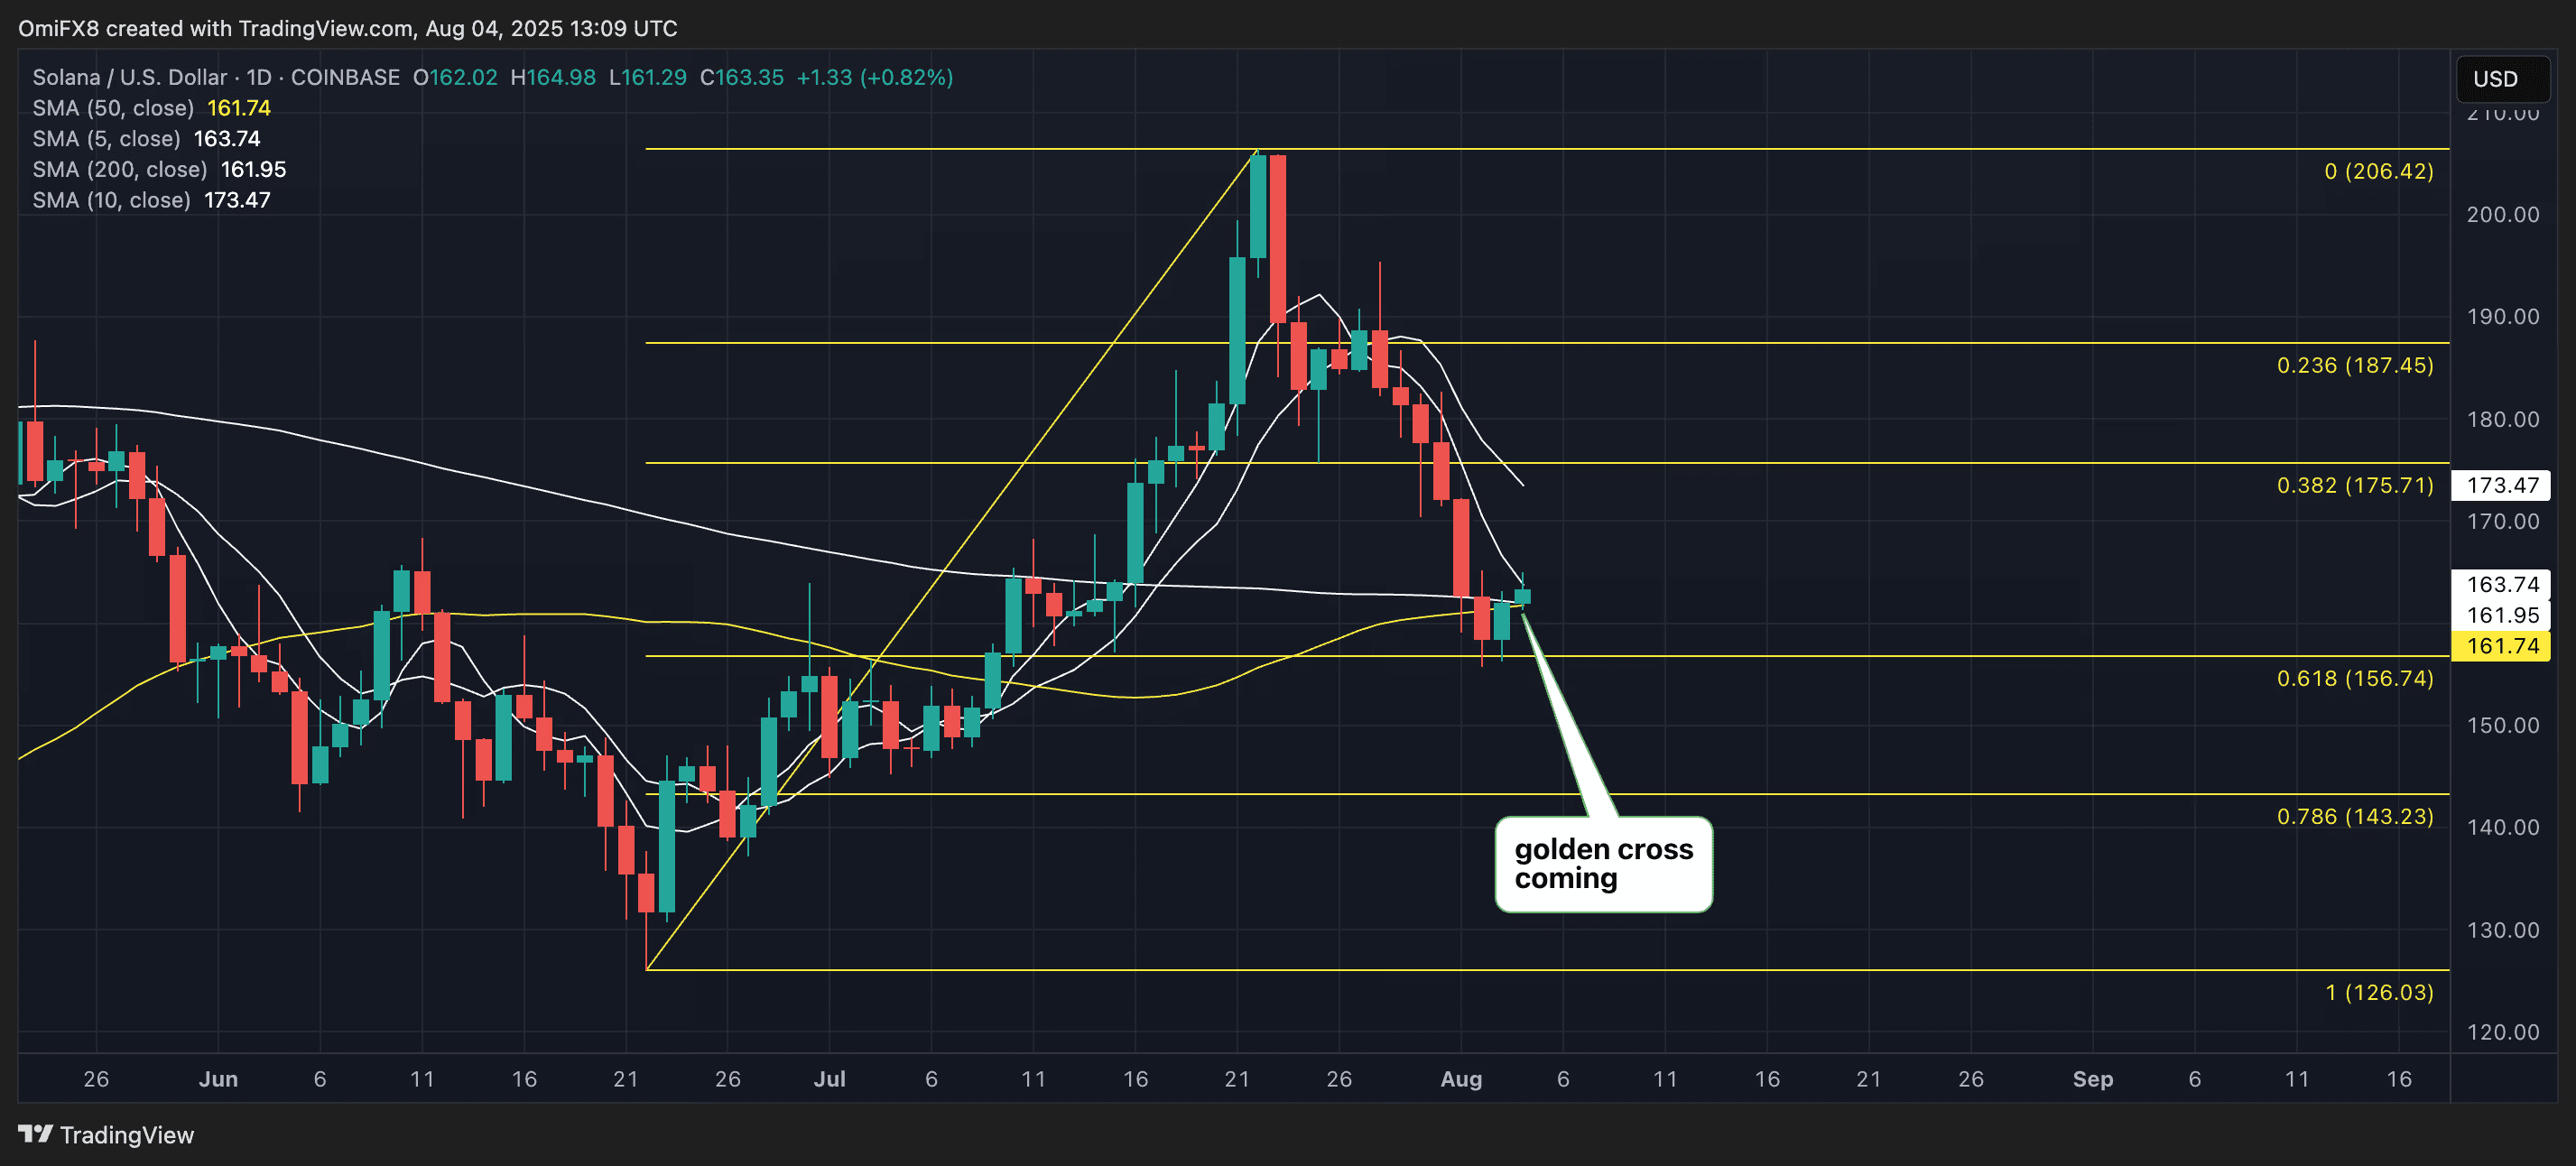
Meanwhile, a significant long-term signal is emerging: the 50-day and 200-day SMA are nearing a "golden cross". Although this is a lagging indicator, a successful crossover would be a strong long-term bullish signal, confirming a significant change in momentum and potentially setting the stage for a new, sustainable uptrend.
For traders, the coming days are crucial, with the Fibonacci 61.8% level needing to hold as support, while the upcoming golden cross will create long-term bullish momentum. It is also important to note that although the Fibonacci level is being protected, the short-term trend remains bearish, with the 5-day and 10-day simple moving averages continuing their downward trend.
Resistance levels: $175, $187, $200.
Support levels: $156, $145, $126.