
Bitcoin plummeted to $112,000 over the weekend, but despite the volatile start to August, this correction could indeed be the springboard for a strong upcoming recovery.
Bitcoin's 'Power of 3' Pattern Aiming for $126,000
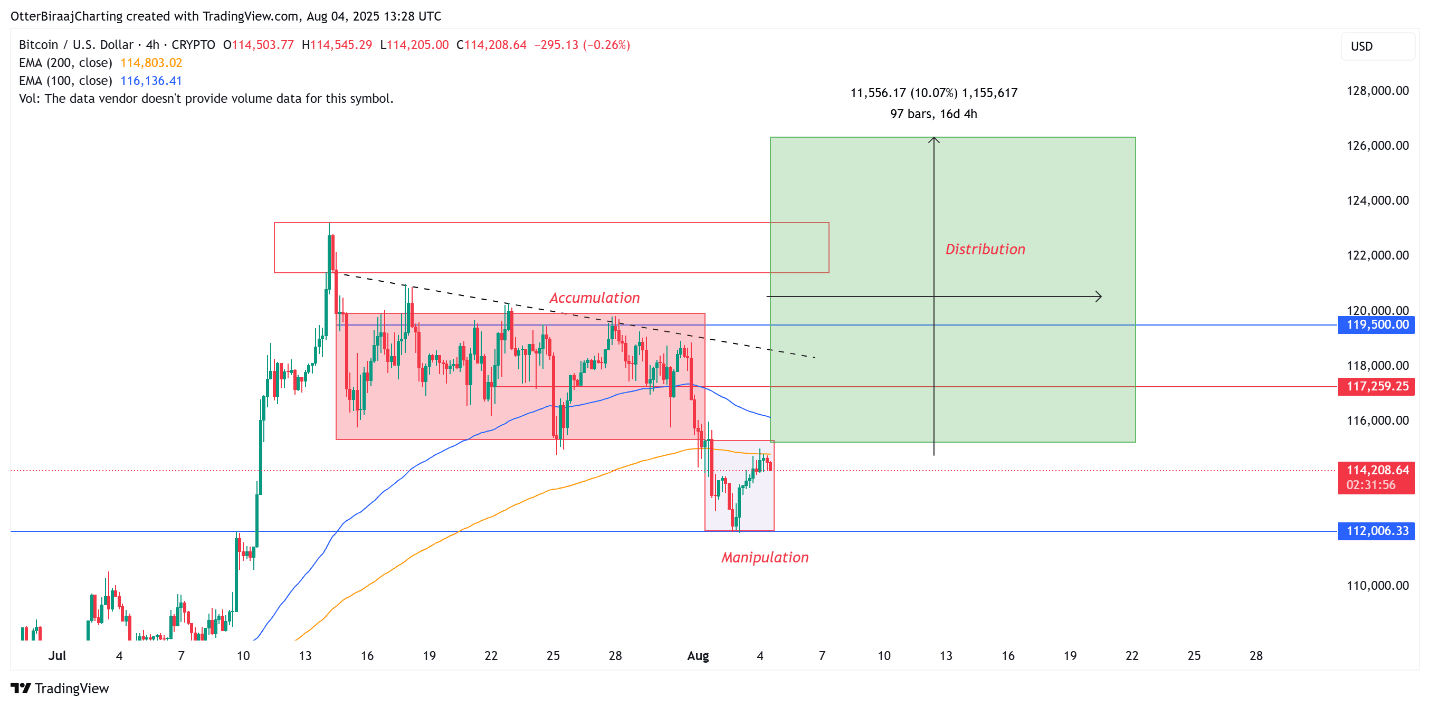
The short-term price movement of Bitcoin is showing the formation of the 'Power of 3' market pattern, consisting of three phases: Accumulation, Manipulation, and Distribution – AMD. This pattern reflects how liquidity flows are navigated, often tied to the strategies of institutional investors — in contrast to the emotional responses from retail investors.
– Accumulation: Prices have stabilized in the $119,500 – $115,300 range, indicating a foundational phase.
– Manipulation: This was followed by a sharp drop, bringing BTC down to around $112,000 — viewed as a 'shakeout' phase, aimed at removing late buying positions and triggering selling sentiment from individual investors.
– Distribution: If Bitcoin can regain and maintain the $115,300 level firmly across both short and long timeframes, the market may enter a distribution phase, with price targets aimed at the $126,000 area — coinciding with recent technical resistance clusters.
If this pattern is confirmed, it signals not only a short-term recovery but could also mark a strong return of the upward trend, potentially surprising traders who are on the sidelines or bearish.
Bitcoin Fills the Logical Value Gap, Retests Important Support Area
Bitcoin has effectively absorbed the logical value gap (FVG) on the larger timeframe, lying in the range from $115,200 to $112,000. This area coincides with the previous historical peak in May, now becoming a key support area for the market.
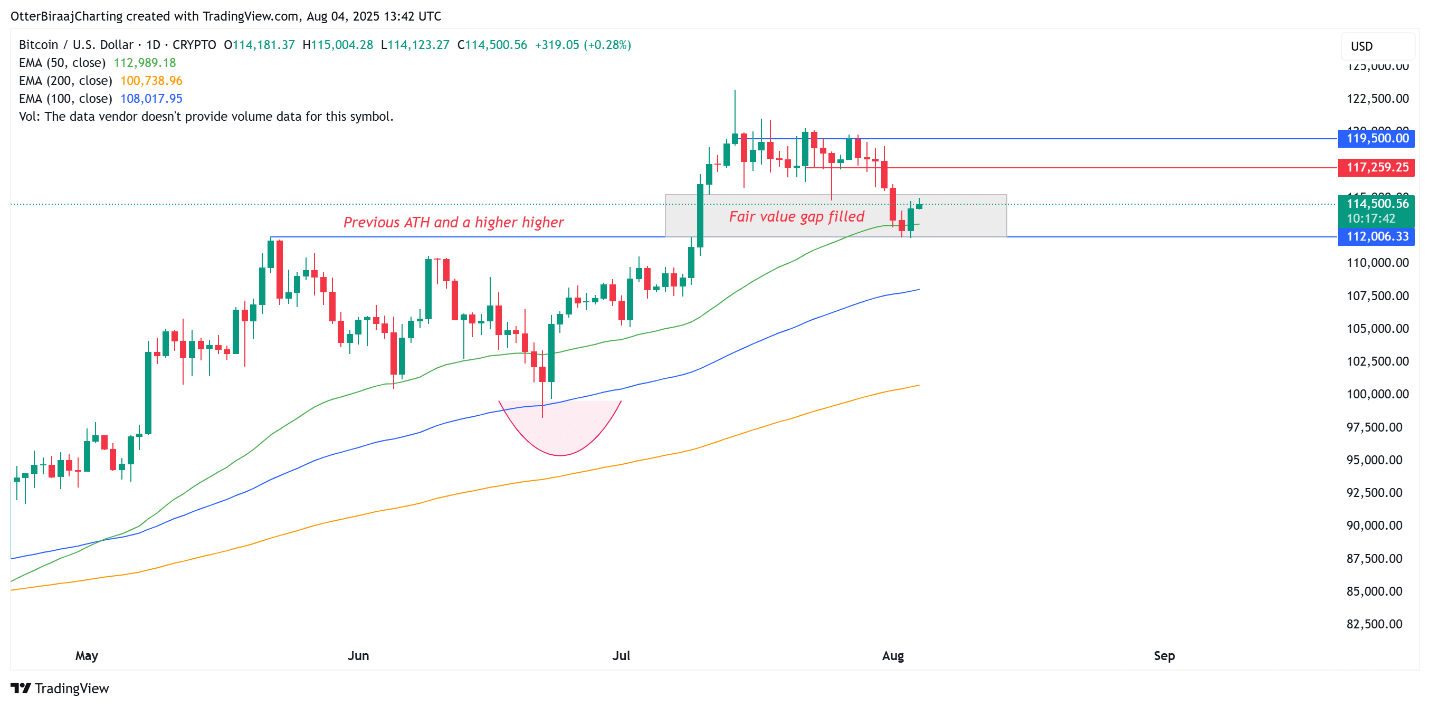
A rapid liquidity sweep into this value gap, accompanied by a price recovery bounce, reflects the potential strength of the market. The retest of the support area around the old peak of $112,000, along with the absorption of the imbalanced supply near $115,000, indicates that selling pressure may have exhausted, opening up a high possibility for an upcoming bullish reversal.
The $922 Million Liquidation Event Resets Market Direction
The crypto futures market has undergone a significant reset, reflecting a marked change in investor sentiment. In recent days, the total Open Interest (OI) value of Bitcoin has sharply decreased from $88 billion to $79 billion, significantly narrowing leveraged positions.
This correction coincided with a major liquidation event of up to $922 million across the crypto market on August 1 — the highest since February 2025 — with Bitcoin futures alone accounting for over $240 million.
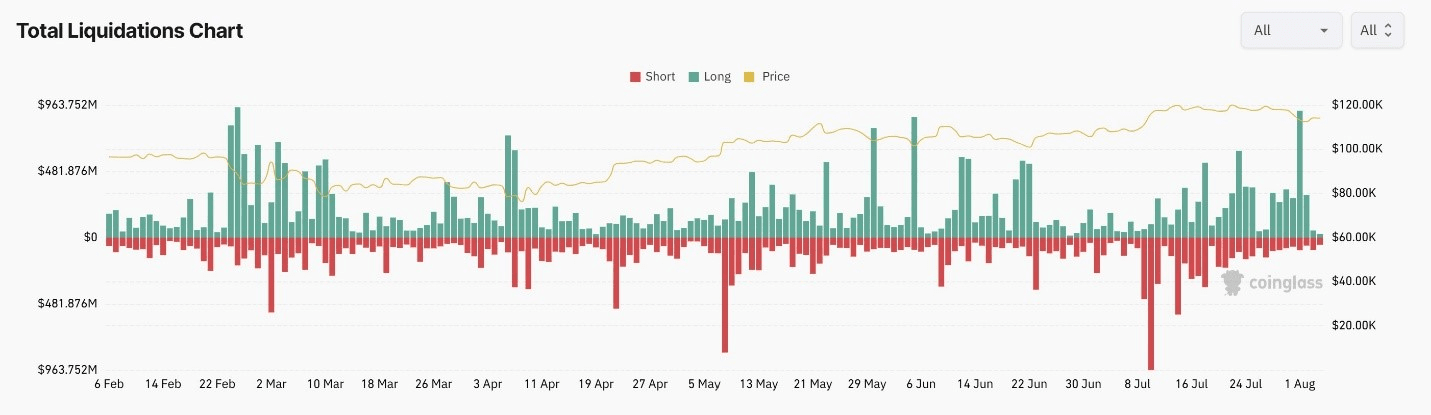
Such a leverage flush often carries positive historical signals, as it helps eliminate excess risks and paves the way for establishing new buying positions.
Meanwhile, crypto analyst Amr Taha points out that the funding rates on major exchanges like Binance, BitMEX, and Deribit have turned negative — a rare phenomenon during strong trend phases. Negative funding rates mean that short positions have to pay fees to long positions to maintain their orders, indicating that retail investors are leaning heavily towards the expectation that the market will continue to decline.
When combined with recent liquidations, this imbalance may signal potential bullish momentum. In the context of market sentiment becoming extremely negative and funding rates being compressed, conditions may be set for a robust recovery.
Net Taker Volume on Binance Indicates Capitulation Signal
Data from CryptoQuant shows that net taker volume accumulated on Binance has fallen below -$1.5 billion — the lowest level since July 25. This index measures the net cash flow from market orders, and a deep negative value reflects the prevailing active selling pressure.
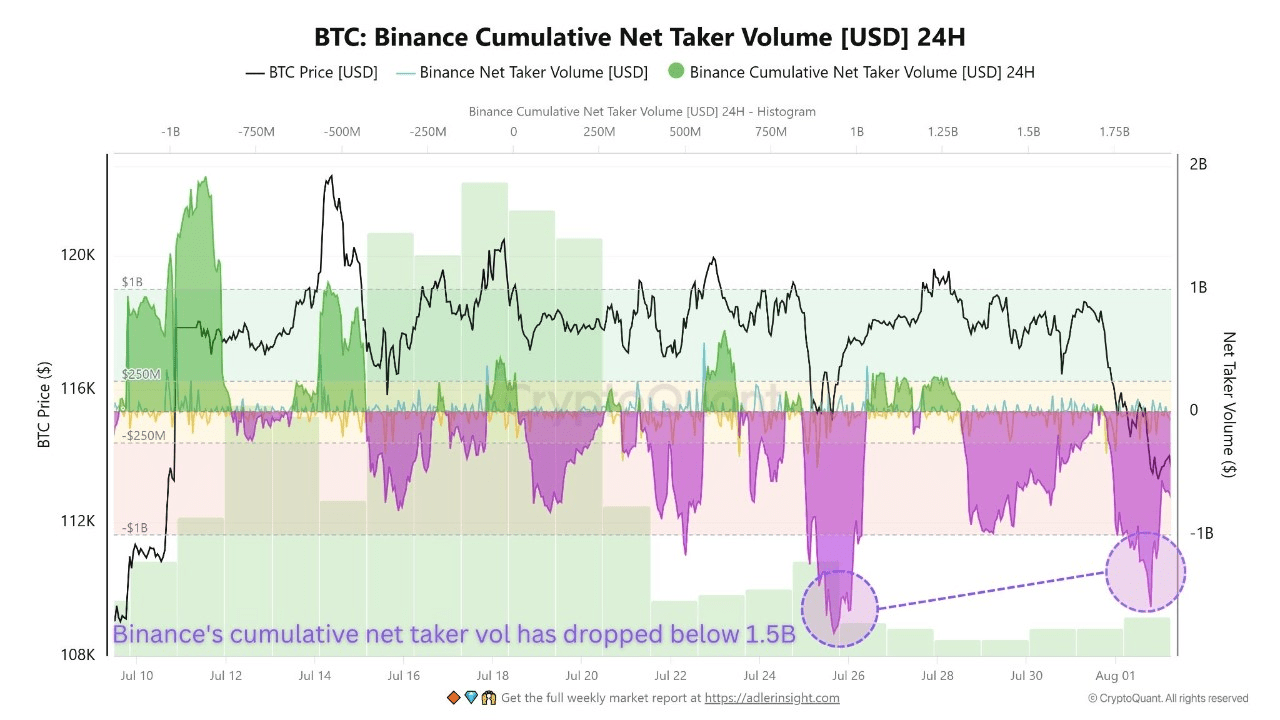
This deep decline is likely driven by forced liquidation of late buying positions, particularly those opened when prices bounced above $114,000. Observing the chart, losses are concentrated primarily in this price area.
Analyst Amr Taha notes that this is a familiar pattern, as retail investors tend to buy at the peak and sell at the bottom, heavily influenced by emotions rather than a systematic strategy. Such a panic sell-off may have marked a local bottom, creating an attractive accumulation opportunity for more calculated investors.
$120,000 May Become a 'Price Magnet'
The liquidation heatmap of Bitcoin shows a dense cluster of liquidations around the $120,000 area, acting as a 'price magnet' if the upward momentum is maintained and solidified. Technical analyst Michaël van de Poppe states that BTC is facing a key resistance area, and breaking this threshold will be a 'significant step' toward new historical highs.
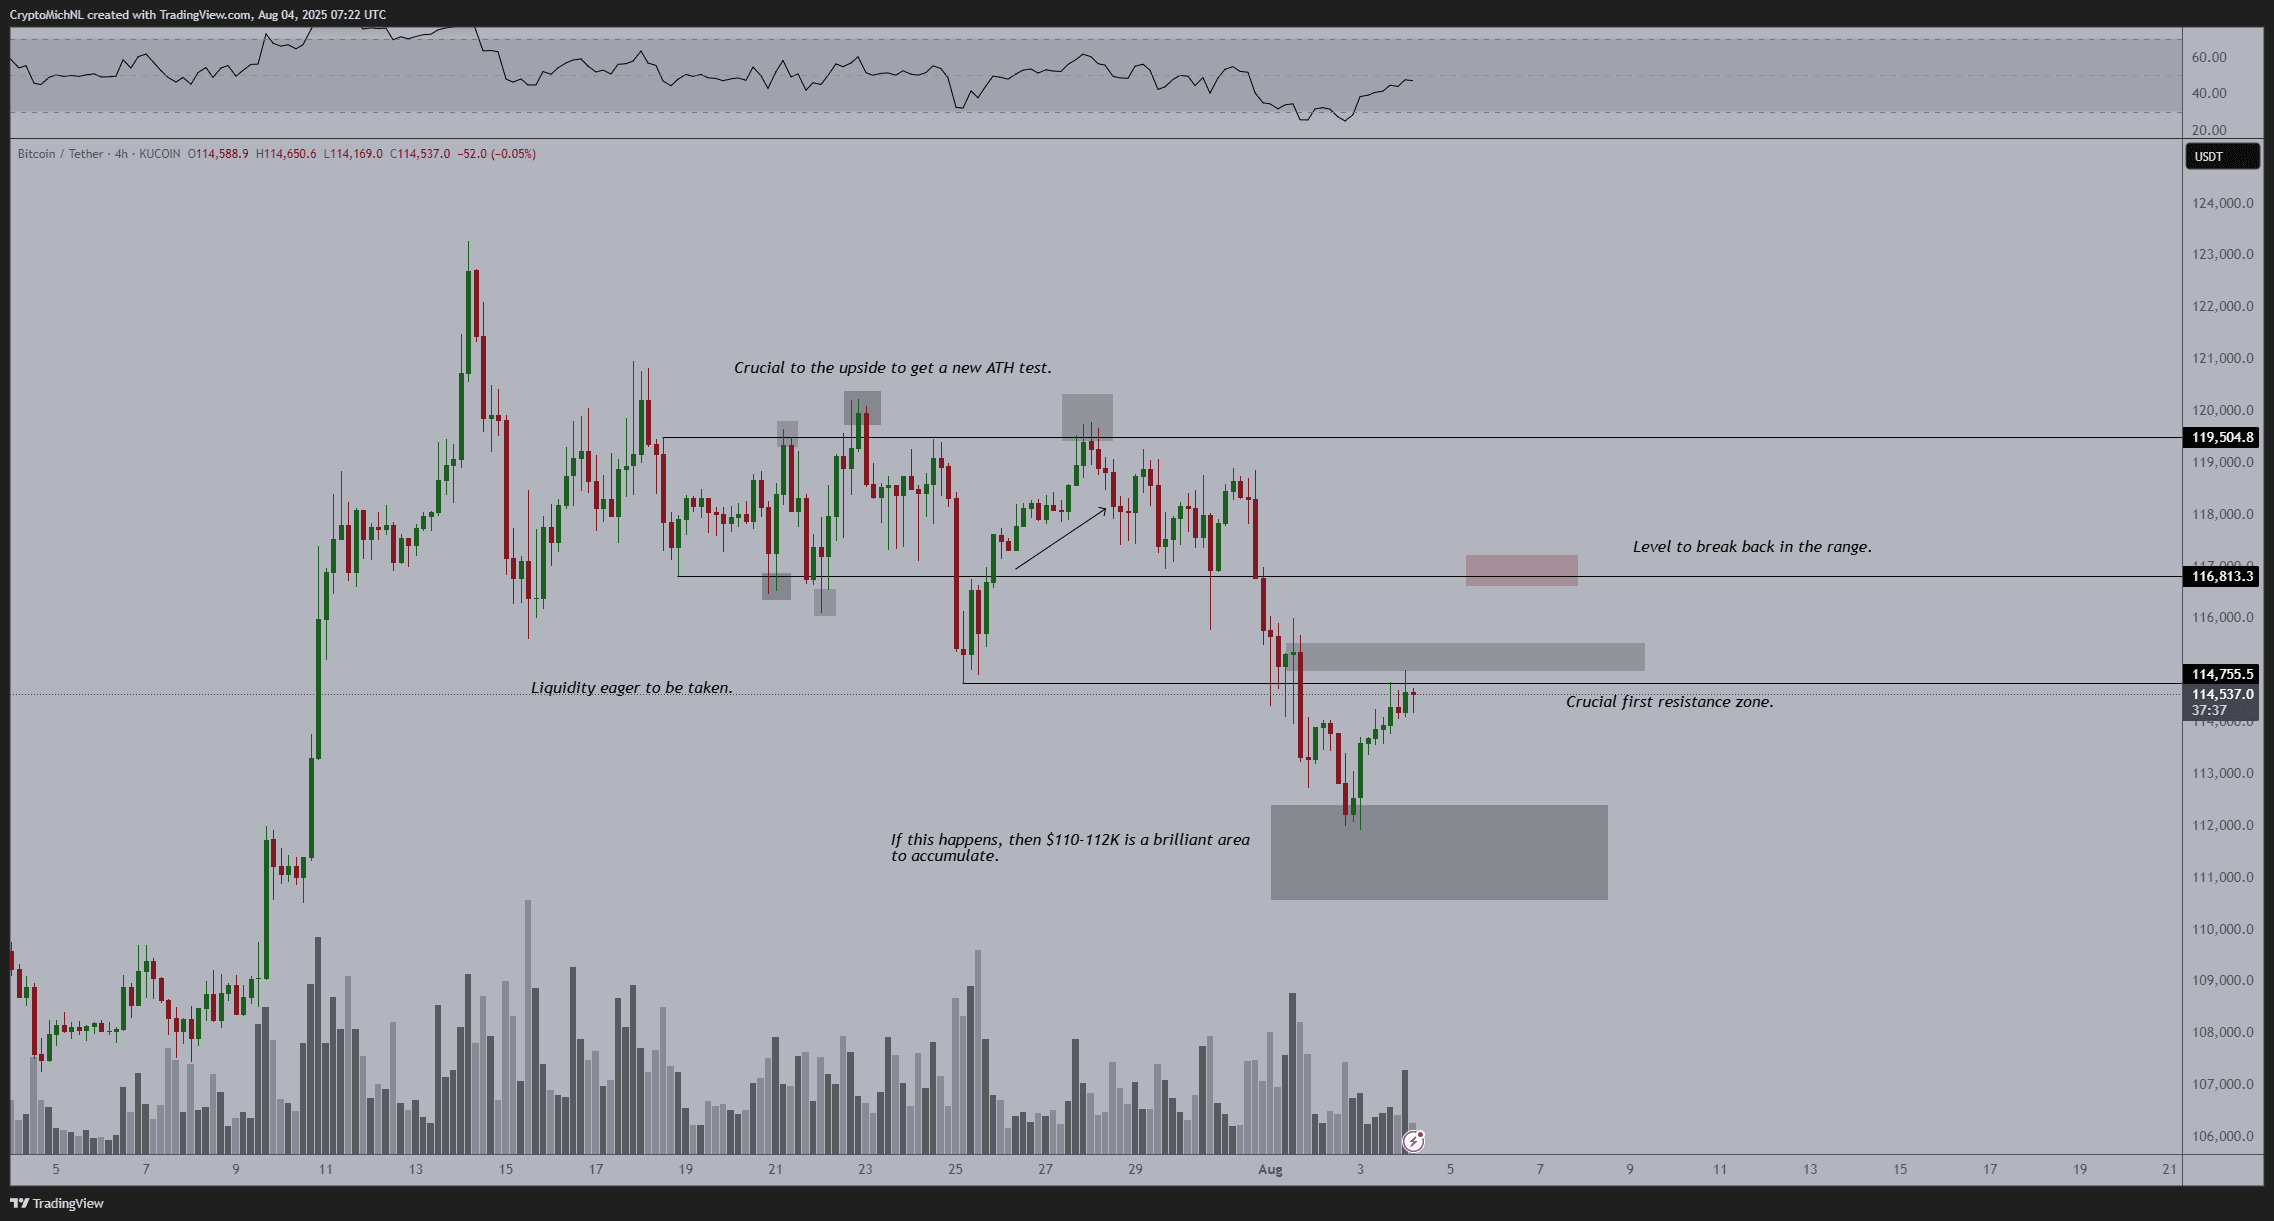
Michaël van de Poppe also emphasizes the price levels of $114,800 and $116,800 as key resistance points to overcome. However, he warns that the risk of prices temporarily retesting the support area around $110,000 in the short term still exists. If successfully breaking through these resistance levels, BTC could very well aim for $120,000 or higher in the coming weeks. $BTC
