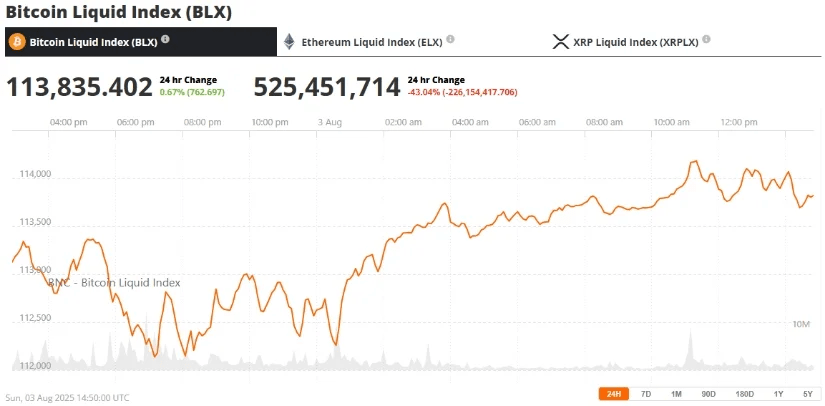
On Monday (August 4), trading in the Asian market began with Bitcoin rising slightly above $114,000, after unexpected weak non-farm data caused it to fall below the $115,000 mark, dipping to support near $112,000. The overall market atmosphere turned cautious due to deteriorating global risk sentiment, increased inflows to exchanges, and technical pattern breakdowns.
As of the time of writing, Bitcoin's current price is about $114,667, down over 6% from the mid-July high of $123,300. Technical indicators suggest a bearish short-term outlook, with Bitcoin having broken below a symmetrical triangle pattern and forming a typical 'three black crows' pattern on the 4-hour chart, which usually signals a continued downward trend.
Macroeconomic factors and market sentiment outlook
Latest U.S. economic data shows that job growth in July was below expectations, with only 73,000 new positions created, far less than the estimated 104,000. Meanwhile, core PCE inflation remains high at 2.8%, raising market expectations for a Fed rate cut in September to 83%.
Former BitMEX CEO Arthur Hayes warned that escalating macroeconomic pressures and global trade tariff tensions could push Bitcoin down to the $100,000 line, representing a 12% decline from the current price. Although this view has not gained widespread acceptance, it reflects growing cautious sentiment in the market.
Currently, the key resistance level is around $116,852, near the 50-period simple moving average (SMA), with short-term resistance at around $114,939 and $117,000. Support levels are at $112,043 and $110,065. The relative strength index (RSI) has slightly rebounded from the oversold zone but remains below 42, indicating weak bullish momentum.
Daily trading volume has surged to over $57 billion, reflecting increased market volatility as traders attempt to interpret conflicting signals between macroeconomic conditions and on-chain data.
Whale inflows, ETF outflows, and institutional anxiety
CryptoQuant data shows that on August 1, accounts holding over 1,000 BTC (whales) contributed over 70% of exchange deposits, with more than 40,000 Bitcoins sent to exchanges at low prices that day, marking the largest single-day inflow since mid-July. This behavior pushed the 'whale proportion on exchanges' to historically high levels associated with short-term selling pressure.
Meanwhile, the U.S. Bitcoin spot ETF saw an outflow of $812 million in a single day, marking the second-largest single-day outflow in history. Analysts believe this is a profit-taking behavior by institutions amid heightened macro uncertainties and tightening liquidity.
Trump's $2 billion investment: a gamble or a turning point?
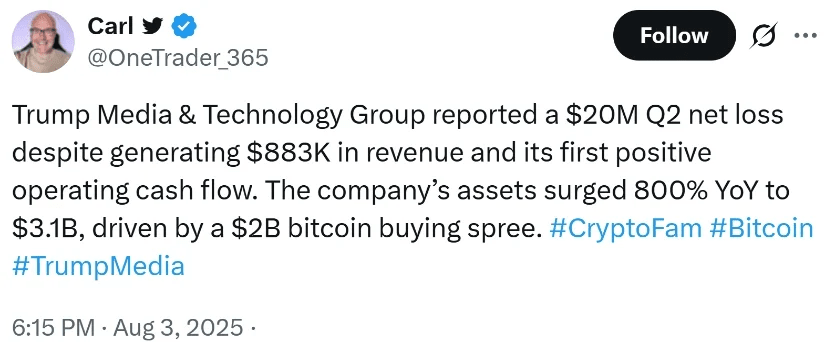
Amid market turbulence, Trump Media and Technology Group announced it would invest $2 billion in Bitcoin and related assets. Its second-quarter financial report revealed that it had also adopted a $300 million options strategy to increase its exposure to Bitcoin price movements, placing the company among the top five publicly listed companies by Bitcoin holdings globally.
Despite a net loss of $20 million in the second quarter and only $883,000 in revenue, the company's total assets soared by 800% year-on-year to $3.1 billion due to the increase in Bitcoin assets. CEO Devin Nunes stated: 'The liquidity brought by this strategy will support the company's expansion in streaming, artificial intelligence, and potential crypto ETF products.' This move highlights Trump Media's ambition to integrate blockchain into its media and technology ecosystem.
Meanwhile, MicroStrategy reported a net profit of $10 billion in the second quarter due to unrealized gains from its Bitcoin holdings. Japan's Metaplanet is preparing to raise $3.7 billion with the aim of expanding its Bitcoin reserves twelve-fold before 2027. These trends reinforce market confidence in Bitcoin as an 'anti-inflation asset' and a long-term institutional allocation target.
Expert opinions: predictions and long-term outlook
Despite increased short-term volatility, several analysts remain optimistic about Bitcoin's long-term trend. Historical data shows that Bitcoin often experiences significant fluctuations around the halving event. The next halving is expected to occur in April 2025, when the block reward will decrease from 6.25 BTC to 3.125 BTC, further tightening new supply.
Crypto economist Arslan Butt pointed out: 'Every halving compresses supply, triggering a price surge. After the 2020 halving, Bitcoin rose nearly 600%. If conditions are similar, reaching $200,000 in 2026 is not impossible.'
Additionally, the Bitcoin network fundamentals remain strong, with nearly 400,000 transactions processed daily, achieving a market cap of about $2.7 trillion, and only about 1.4 million Bitcoins left to mine, which further strengthens the long-term bullish logic.
Looking ahead: where will Bitcoin go next?
The market is currently at a critical juncture, with a massive entry from Trump Media on one hand and uncertainties in macroeconomics and liquidity on the other. The future direction of Bitcoin will gradually emerge under the influence of both.
In the short term, market volatility may persist, especially in cases of active whale trading or continued ETF outflows. However, from a longer-term perspective, as the pace of institutional adoption accelerates and the 2025 halving approaches, the overall market environment remains favorable.
Whether Bitcoin can hold the key support level of $112,000 will be crucial in determining the trends for the third and fourth quarters.
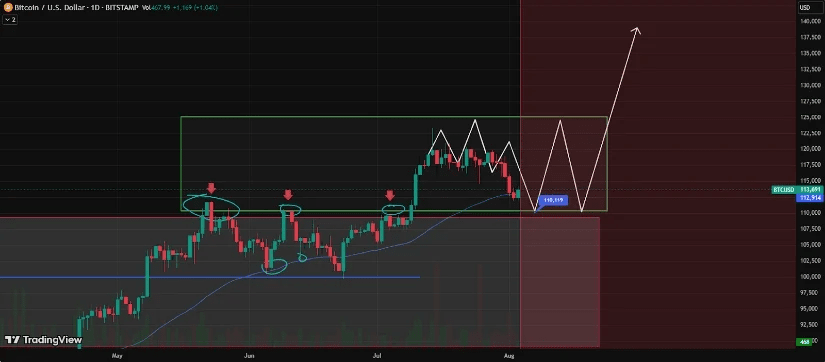
Bitcoin technical analysis
Last week, as global risk sentiment deteriorated, the cryptocurrency market faced pressure, causing Bitcoin to retreat from recent highs. Although the adjustment was substantial, the price stabilized near a set of key technical supports, providing bulls with an opportunity to regroup.
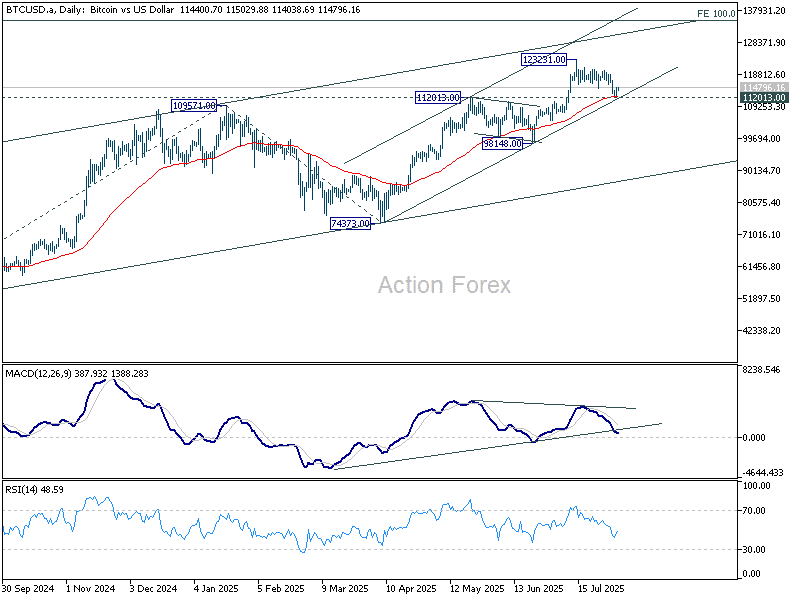
Currently, three key support levels are converging: the pre-May high of $112,013; the 55-day exponential moving average (EMA) at $112,331; and trendline support around $111,400.
If overall market sentiment does not deteriorate further, these support levels are expected to form a solid foundation for Bitcoin to challenge the historical high of $123,231 again.
However, subsequent gains may be limited as momentum indicators issue warning signals. The daily MACD indicator shows bearish divergence, indicating that upward momentum is weakening. There is strong resistance near the 100% extension level of $134,936 (projecting from $49,008 up to $109,571, then retracing to $74,373), which is expected to restrict price increases.
Currently, Bitcoin's upward trend continues, but the upward space is expected to form a top below $135,000.