#LINK /USDT Direction: LONG ✅ Promising signal
📊 Indicators:
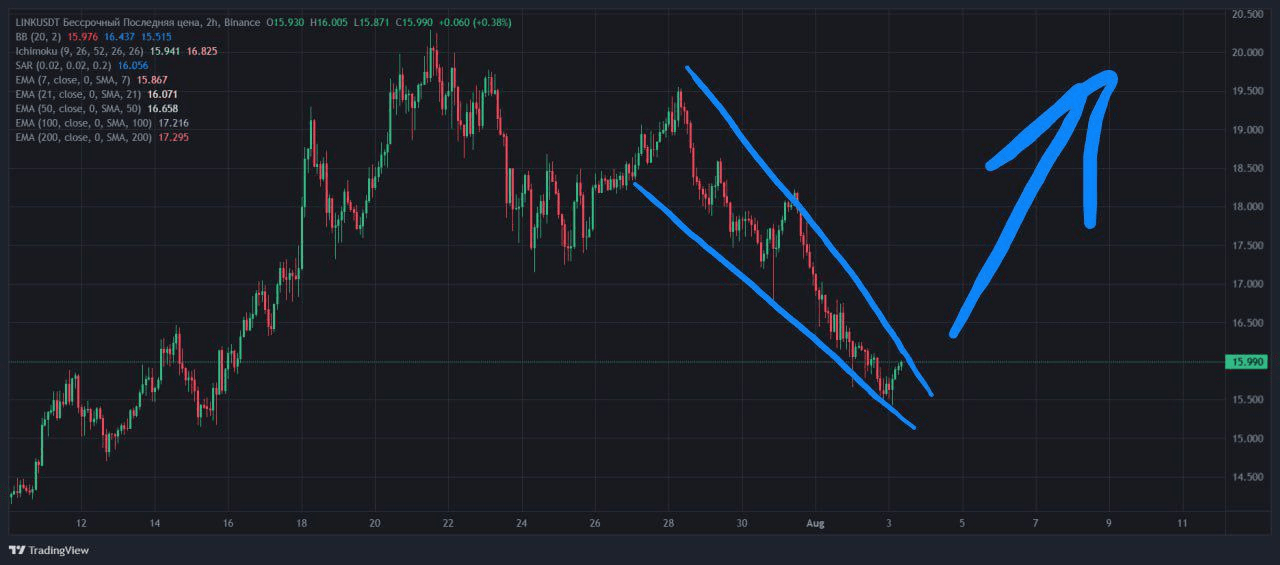
Figure:
A "Falling Wedge" is clearly visible — this is a bullish reversal pattern.
The upward breakout has already begun, confirming the reversal scenario.
RSI (14, 2H): 42.92
→ Below 50, but already reversing — there is room for growth without overheating.
MACD:
▸ MACD line crossing above the signal line → bullish signal
▸ The histogram is positive and gaining volume
SAR:
SAR is above the price (16.05), but nearby — upon breaking 16.05 it will switch to bullish → possible trigger.
Ichimoku Cloud:
The price is at the cloud border — upon breaking the level of 15.94–16.00 — this will confirm a bullish breakout.
EMA:
The price is closely approaching EMA 7, 21, 50 — upon a breakout upwards (with consolidation) the path to EMA100–200 (17.2 / 17.3) will open.
Bollinger Bands:
The price has exited the lower band and is striving towards the center → a sign of reversal or the start of an upward movement.
Volume:
Volume is gradually increasing — it will strengthen with the breakout of the trendline.
📌 Conclusion:
All key technical elements confirm the start of a bullish movement.
The signal corresponds to the early phase of a potential reversal.
🔥 Insights from INVESTIDEAUA: Intraday trading, LONG/SHORT strategies, SPOT, education.
🎯 I would be pleased to know that my work was not in vain.
🎯 I would appreciate your subscription.
🎯 Your support and feedback always inspire me to continue sharing quality content.
#profit #cryptotrading #CryptoStrategy #CryptoNews