
The market is under selling pressure, which may lay the groundwork for falling prices.
XRP officially broke below the $1 mark today, which has become an unexpected bearish signal for many. Currently, its price is around $2.92, having gradually declined from the July high of over $3.70. The trend has become quite clear: $3 no longer serves as solid support, and the bullish advantage is waning.
The current price has fallen below the 26-day moving average, indicating weak resistance to the downward trend. During this round of correction, the trading volume has remained neutral, showing that the market has not fallen into panic, while also indicating low buying interest. The RSI is currently around 40, with momentum clearly weakening, having broken below the midline, further confirming the overall bearish pattern.
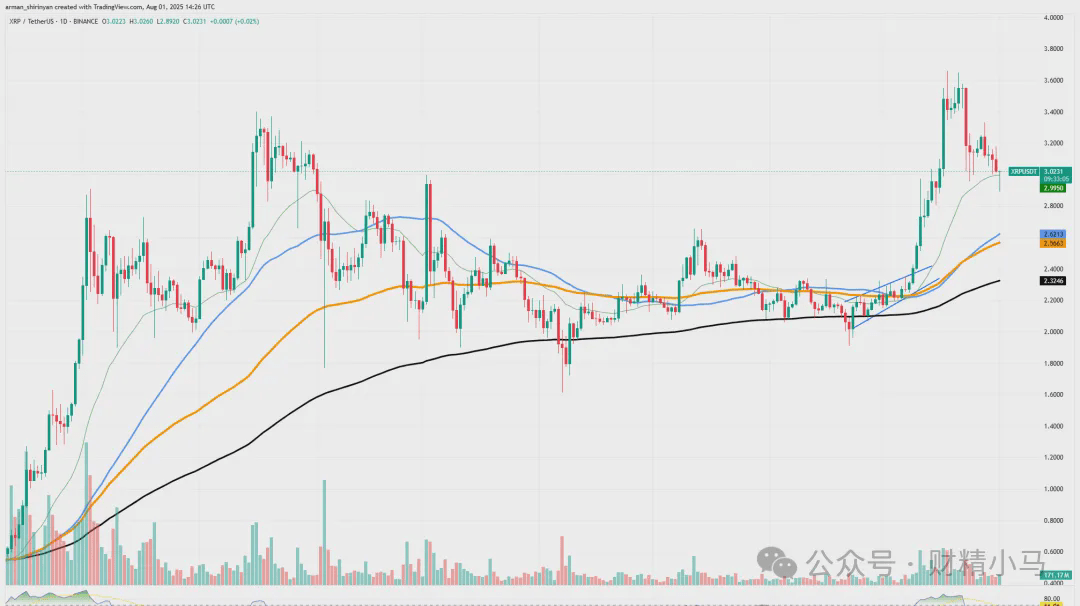
What does this mean for investors? Firstly, expectations about the $3 mark should be re-evaluated. While holding this integer level can provide psychological comfort to traders, it may also mask the actual market structure. After multiple failed retests, $3 appears more like resistance than support. Currently, the area between $2.70 and $2.60, which gathers some historical support points and the 50-day moving average, is the key observation point going forward.
If XRP finds support in the $2.30 to $2.20 range, it may retest that area; however, if it breaks down further, the price may enter a phase of consolidation. XRP's upward momentum is clearly slowing, and being overly fixated on prices above $3 will affect the timing for optimizing positions. If buying interest continues to weaken, the downward trend is likely to persist. Rather than clinging to breached price levels, it is better to adjust strategies according to the trend.
Ethereum faces a significant setback

Ethereum once approached the $4,000 mark but has now entered a necessary technical correction phase. Considering that the RSI previously surged to 78, which is a rare high in a trending market, this round of decline is not unexpected. Currently, the 26-day exponential moving average is gradually coming into play, which may become the first key support area after this round of increase.
After sliding nearly 10% from its local peak, ETH is currently reported at about $3,620. Despite consecutive bearish candles, the price remains above the major moving average area. The 26-day moving average is quickly approaching the market; if selling pressure gradually diminishes, the $3,480 level may become a key support to stabilize the market, pushing it into a consolidation zone rather than continuing to decline sharply.
Volume data indicates that selling pressure remains, but it has not significantly increased, suggesting that the current trend leans more towards a cooling off rather than panic selling. Meanwhile, the RSI has retraced to 61, moving out of the overbought zone and returning to a neutral position, building momentum for future rebounds.
If the 26-day moving average can hold firm, ETH may build a short-term bottom here, gearing up for subsequent rises. Conversely, if this line is breached, attention should be paid to the $3,000 range (i.e., the 50-day moving average position), which has shown support effects in past corrections. Currently, Ethereum appears to be cooling down rather than collapsing.
Overall, the 26-day moving average is currently the most critical technical reference point, which will determine whether ETH can maintain a healthy correction or enter a deeper downturn. The upcoming days will see the $3,480 to $3,500 range as a key focus.
Bitcoin has significantly declined

It now appears that $120,000 is no longer a launching pad for upward breakthroughs, but rather more like a ceiling pressing down. Bitcoin has completely fallen below this threshold. Since it has never effectively established itself above this resistance range, Bitcoin has declined over 7% from its local peak, currently reported at about $114,798.
At least from a short-term perspective, the breach of this psychological level marks a shift in market sentiment from optimistic to cautious. The weakening of momentum has left the bulls passive; every attempt to push against the $120,000 mark has seen a noticeable decline in trading volume, reflecting a waning enthusiasm for buying. The RSI has fallen below 60, indicating that the upward trend has been weakened.
Currently, the 26-day moving average is around $111,800, becoming the next key support. In the recent upward phase, this line has provided effective support multiple times. If Bitcoin can rebound from this point, there may still be an opportunity to challenge the resistance above again. However, if it breaks down, the correction target may point to the 50-day moving average around $107,000, which is a more solid support area. At this stage, $120,000 can no longer serve as a definitive reference.
This round of decline is not purely a technical response; it is also influenced by the strengthening of the U.S. macroeconomy. If Bitcoin cannot rebound near the 26-day moving average, investors should prepare for horizontal consolidation or even a deeper correction.
If a strong rebound is lacking, it will be difficult to regain upward momentum in the short term; however, as long as the structure is not broken, a rebound may still retain a bullish outlook. Overall: a phase of farewell to $120,000; before the market regains confidence, Bitcoin must find its rhythm again and consolidate key support areas.