We just focus on analyzing the charts. The market naturally goes up and down; fluctuations are completely normal. Don't be misled by short-term volatility; what truly determines the trend is the broader market direction.
Take the currency pair trends for example; if it continuously creates higher highs and higher lows, it is clearly in an uptrend. Even if it dips in the short term, don’t panic; this is just a correction because in the medium to long term, the price is definitely moving upwards. The current situation with SUI is just like this, and it has been sustained for several months now.
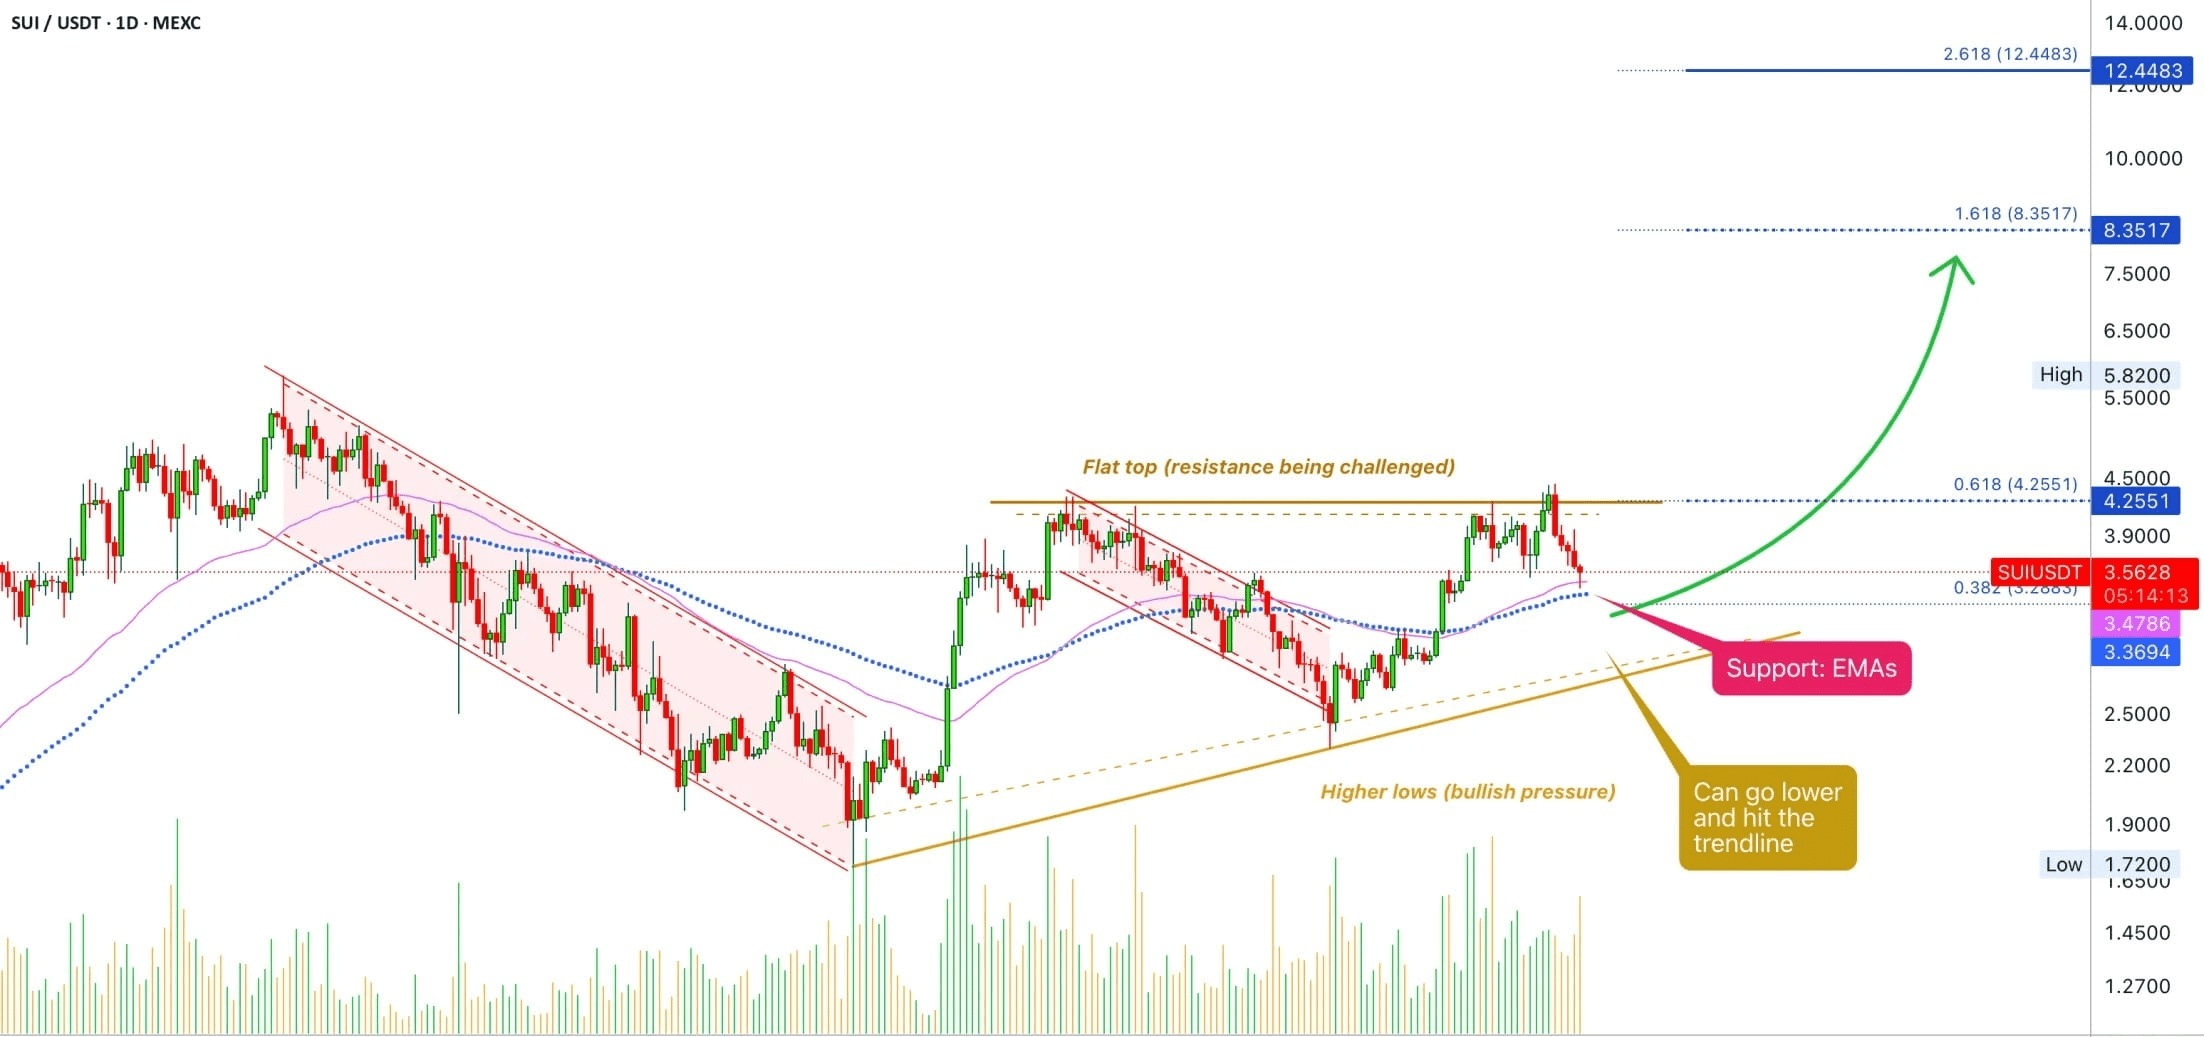
SUI finds support at every pullback against USDT and then continues to rise. Five days ago, on July 28, it reached its peak and then started to pull back; for the past few days, all the trades have turned from green to red, which is a typical correction trend. When the price hits a resistance level, it will immediately test the support level, and once the support level is tested, it often challenges a new resistance level.
The daily support levels for SUI are at EMA89 and EMA55, just like the active levels we mentioned in our last update. So far, these two support levels have been quite stable; if they can hold, then the rise will come soon. However, support levels can sometimes be briefly broken, after which the market may turn, so anything can happen.
Continuously monitor MAGIC IDEX BABY CFX