🌇 1. Evening Star (Bearish Reversal)
Appears at the top of an uptrend. Signals a shift from bullish to bearish momentum.
🔻 Sell signal when third candle closes below first.
🌅 2. Morning Star (Bullish Reversal)
Forms at the bottom of a downtrend. A sign of bearish exhaustion and buyer strength.
🔺 Buy signal on breakout above the third candle.
---
🐦 3. Three Black Crows (Bearish Reversal)
Three consecutive red candles with lower closes. Suggests strong selling pressure.
📉 Often follows an overbought rally.
🪖 4. Three White Soldiers (Bullish Reversal)
Three strong green candles marching higher. Implies momentum shift to buyers.
📈 Powerful signal after prolonged downtrend.
---
📈 5. Rising Three Methods (Bullish Continuation)
Big green candle → small red pullbacks → another strong green candle.
⚡ Consolidation in an uptrend—get ready for more upside.
📉 6. Falling Three Methods (Bearish Continuation)
Opposite of rising three. A breather during a downtrend before the next leg down.
🚨 Use this to re-enter short positions.
---
🌟 7. Tri-Star Top (Bearish Reversal)
Three dojis at the top of a trend = indecision and reversal likely.
⛔ Rare, but powerful bearish signal.
🌠 8. Tri-Star Bottom (Bullish Reversal)
Three dojis at the bottom = buyers regaining control.
🟢 Watch for confirmation candle after.
---
📌 Why These Matter:
Candlestick patterns are most effective when used with volume, support/resistance, RSI or MACD.
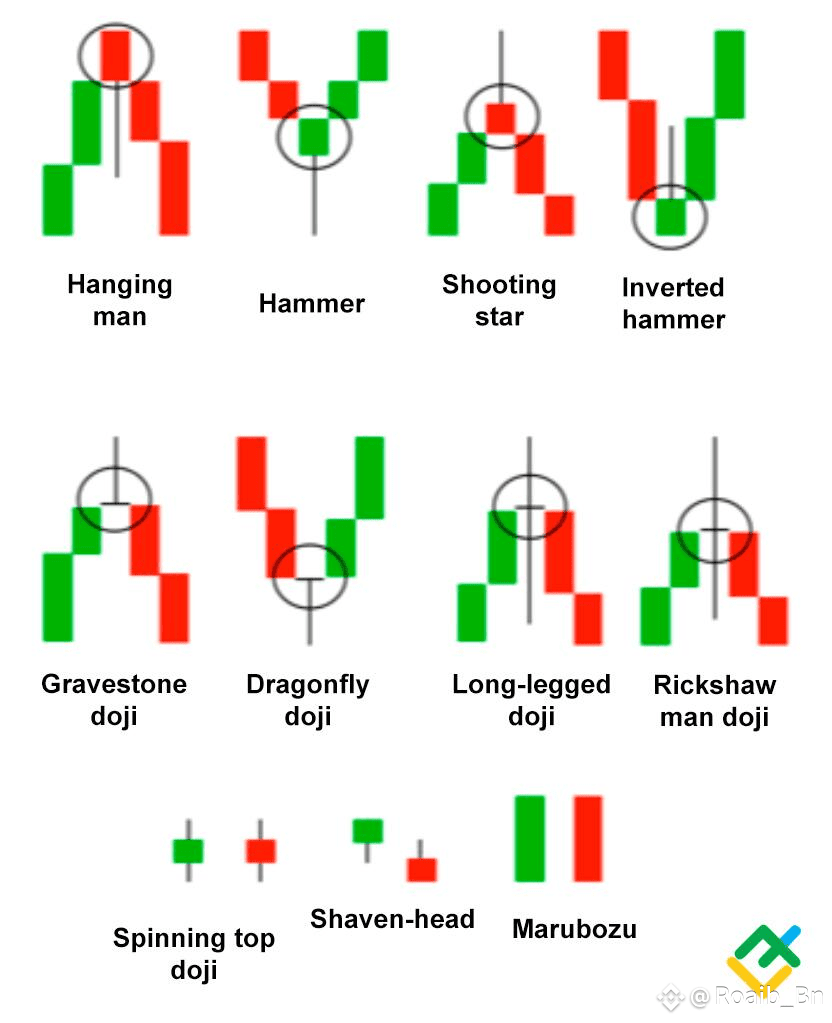
Here is the candles image 👇
💬 Which of these is your favorite pattern to trade?
❤️ Like, 💬 comment & 🔁 share to help others decode the charts!
#TrumpTariffs #MarketPullback #SECProjectCrypto #WhiteHouseDigitalAssetReport #FOMCMeeting
